Tutorial - Post-process STAAD.Pro data
Level: Beginners
Time: 20 min
Prerequisites:
- You have an account and completed the installation process. No account? Get one here
- You have some experience with reading Python code

In this tutorial, you will build a VIKTOR app to process and visualize outputs from STAAD.PRO. You’ll learn how to export these outputs from STAAD.PRO into a VIKTOR web app and post-process design ratios for various cross-sections. Filtering, grouping, and visualizing these design ratio outputs is not possible directly in STAAD.PRO, and there is no native way to export these results directly to Excel. This tutorial will guide you through overcoming these limitations while exploring the powerful tools and building blocks that VIKTOR and Pandas provide.
Here is what we'll cover:
- Create an app with an input block to receive STAAD.PRO data
- Create the structure of our app with steps
- Process the STAAD.PRO data
- Allow user selection, grouping, and filtering of cross-sections
- Visualize results based on those selections
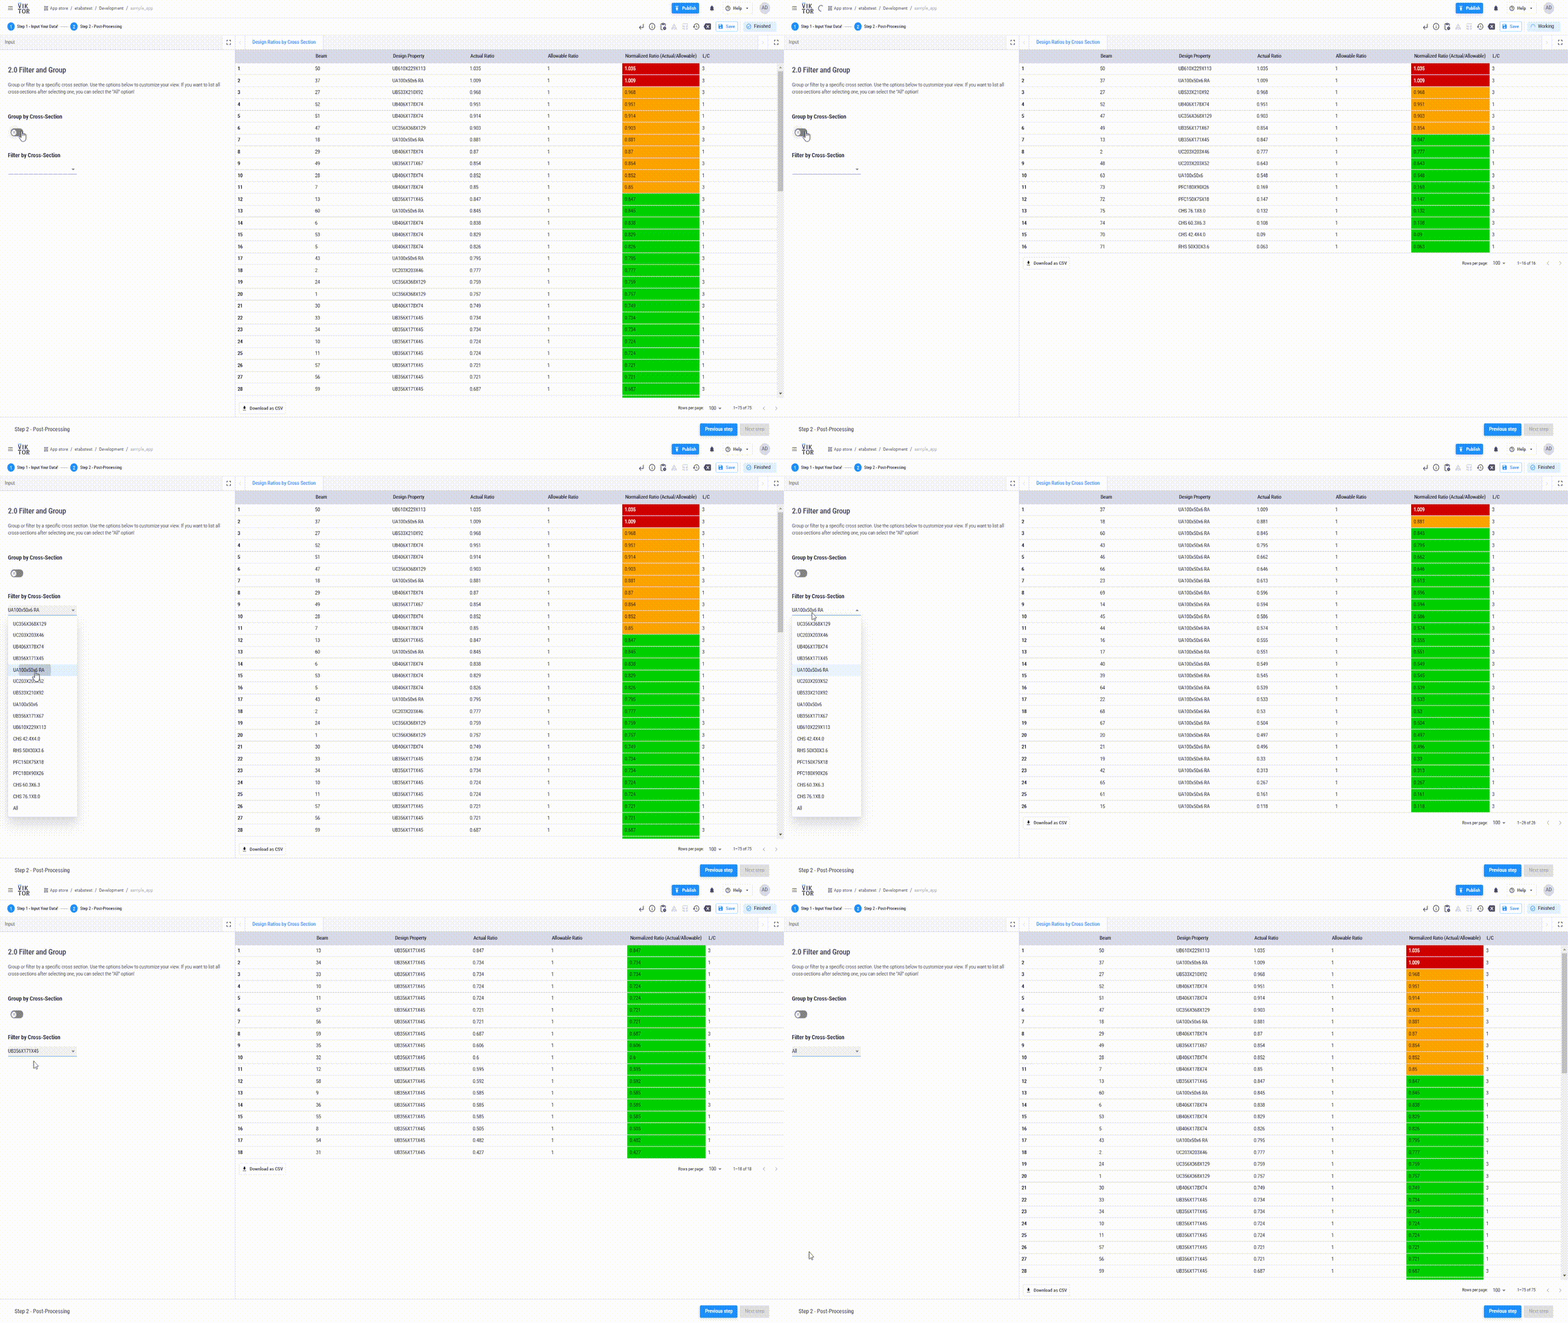
By the end of this tutorial, you will be able to generate a table with a heatmap displaying design ratios for your structure by filtering or grouping specific cross-sections. You will also have the opportunity to test this using your own data by following the steps outlined in the final section of the tutorial. This will help you gain valuable insights from your results and effectively share them with your clients and team.
1. Basic setup
Let’s create, install, and start a blank app template. We’ll use this blank template as the base for our design ratios app. Before we begin, ensure that any running app (like the demo app) is stopped. You can do this by closing the command-line shell (e.g., PowerShell) or by canceling the process with Ctrl + C.
-
Open a terminal and run the following command to create the app on the VIKTOR platform and generate the initial code locally:
viktor-cli create-app "STAAD data tutorial" --init --app-type editor -
Open the newly created folder in your code editor and run
viktor-cli clean-startin the terminal to install dependencies and connect the app to the platform.
If all went well, your empty app is installed and connected to your development workspace. Do not close the terminal as this will break the connection with your app. The terminal in your code editor should show something like this:
INFO    : Connecting to cloud.viktor.ai...
INFO    : Connection is established:
INFO    :
INFO    :     https://cloud.viktor.ai/workspaces/XXX/app  <--- navigate here to find your app
INFO    :
INFO    : The connection can be closed using Ctrl+C
INFO    : App is ready
You only need to create an app template and install it once for each new app you want to make.
The app will update automatically once you start adding code in app.py, as long as you don't close the terminal or your code editor.
Did you close your code editor? Use viktor-cli start to start the app again. No need to install, clear, etc.
Adding useful Python packages
We want to use Pandas and VIKTOR as our only dependencies in this app. Open requirements.txt and add pandas under your viktor version (do not change that line):
viktor==X.X.X  # Don’t modify this line
pandas
Next, close the connection to your app in the terminal (if the app has been connected automatically). You can do this by using Ctrl+C. Open a new terminal and install the new dependencies (like pandas) in your Python environment by running this command:
viktor-cli install
And after that, connect your app to the VIKTOR platform again:
viktor-cli start
Keep the terminal open, as closing it will disconnect your app.
2. Creating the structure of our app
In this step, we will create the structure of our app by organizing it into steps using vkt.Step. This will help us separate the application into inputs and outputs. In the first step, we input the data coming from STAAD.PRO with the vkt.Table, and in the second step, we filter and group the results with a TableView.
Later, we will add a TableView and the logic for the filtering and grouping components on step 2.
Feel free to copy and paste the highlighted lines of code into app.py, save the file, and refresh the app in the browser. You should now see the input fields you just added to the code.
import viktor as vkt

class Parametrization(vkt.Parametrization):
    step_1 = vkt.Step("Step 1 - Input Your Data!")
    step_1.intro = vkt.Text("""
# STAAD Design Ratio Analyzer
This app allows you to visualize a heat map from your STAAD.PRO model results.
You can filter and group them based on cross sections and visualize how they are distributed.""")
    step_1.table_input = vkt.Text("""
## 1.0 Create the Input Table!
Paste the design ratio data from your STAAD.PRO model!""")

    step_1.table = vkt.Table("### Beam Design Analysis")
    step_1.table.col_beam = vkt.TextField("Beam")
    step_1.table.col_analysis_property = vkt.TextField("Analysis Property")
    step_1.table.col_design_property = vkt.TextField("Design Property")
    step_1.table.col_actual_ratio = vkt.NumberField("Actual Ratio")
    step_1.table.col_allowable_ratio = vkt.NumberField("Allowable Ratio")
    step_1.table.col_normalized_ratio = vkt.NumberField("Normalized Ratio")
    step_1.table.col_clause = vkt.TextField("Clause")
    step_1.table.col_load_case = vkt.TextField("L/C")
    step_1.table.col_ax = vkt.TextField("Ax in²")
    step_1.table.col_iz = vkt.TextField("Iz in⁴")
    step_1.table.col_iy = vkt.TextField("Iy in⁴")
    step_1.table.col_ix = vkt.TextField("Ix in⁴")

    step_2 = vkt.Step("Step 2 - Post-Processing")
    step_2.process = vkt.Text("""
## 2.0 Filter and Group
Group or filter by a specific cross section.
Use the options below to customize your view.
If you want to list all cross-sections after selecting one, you can select the "All" option!
""")
    step_2.group = vkt.BooleanField("### Group by Cross-Section")
    step_2.ln_break = vkt.LineBreak()
    step_2.cross_section = vkt.OptionField(
        "### Filter by Cross-Section", options=["Empty Options"]
    )

class Controller(vkt.Controller):
    parametrization = Parametrization()
How this works
-
We organized our app into two steps using
vkt.Step:- Step 1 is for inputting data. We added introductory text using
vkt.Textand created a table calledstep_1.tableusingvkt.Table. This table replicates the columns from the design ratio table in STAAD.PRO. - Step 2 is for post-processing. This step includes the following features:
- Filtering:
- We use
vkt.OptionFieldto show a list of cross-sections that the user can select. - Only design ratios of the selected cross-section will be displayed.
- We use
- Grouping:
- We use
vkt.BooleanFieldto let the user group the design ratios by cross-section. - When grouping is enabled, the app displays only the maximum design ratio for each cross-section.
- We use
- Filtering:
- Step 1 is for inputting data. We added introductory text using
-
The
Controllerclass setsparametrization = Parametrization()to link our parametrization to the controller.
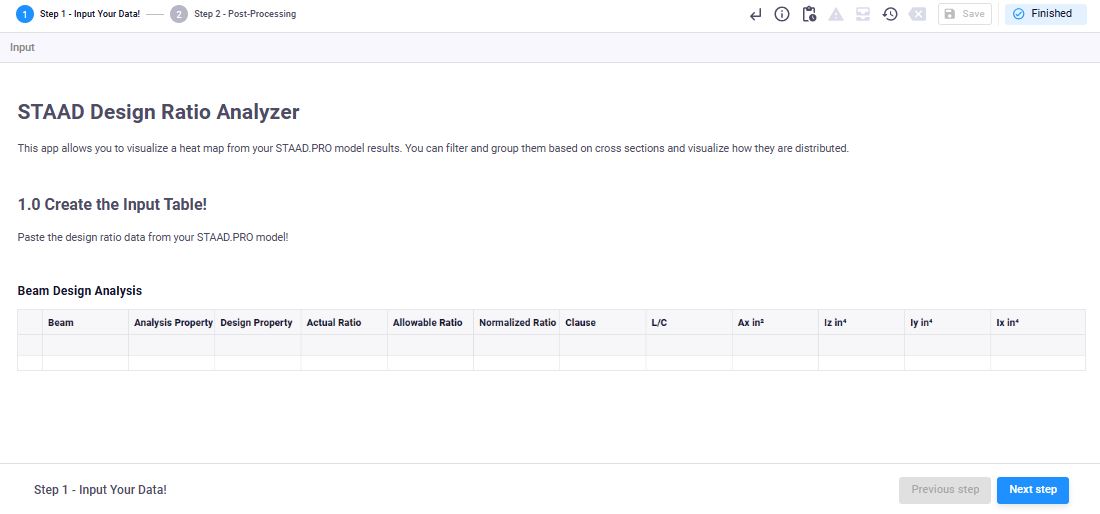
The result should look like the image below. Now that the inputs are ready, we will move on to process the STAAD.PRO data.
3. Process the STAAD.PRO data
Sample STAAD.PRO design ratio data
For this tutorial, you can use this in TXT format, which you can copy and paste into our vkt.Table. However, you can use your own design ratio data from STAAD.PRO. At the end of this tutorial, we will guide you on how to get this data from STAAD.PRO.
The last section of this tutorial shows how to get this data from STAAD.PRO. For now, you can use the sample .TXT file to complete and test the app!
Processing the STAAD.PRO data
The next step is to process the data from the vkt.Table. It's a good idea to do this processing in a separate function, which we'll name generate_dataframe. This function will convert the table data into a Pandas DataFrame and rename the columns for easier access.
Below is the logic in the code, along with a breakdown. Add the highlighted lines of code to app.py and save the file.
import viktor as vkt
import pandas as pd

def generate_dataframe(table_data):
    df = pd.DataFrame([dict(item) for item in table_data])
    df.rename(
        columns={
            "col_beam": "Beam",
            "col_analysis_property": "Analysis Property",
            "col_design_property": "Design Property",
            "col_actual_ratio": "Actual Ratio",
            "col_allowable_ratio": "Allowable Ratio",
            "col_normalized_ratio": "Normalized Ratio (Actual/Allowable)",
            "col_clause": "Clause",
            "col_load_case": "L/C",
            "col_ax": "Ax in²",
            "col_iz": "Iz in⁴",
            "col_iy": "Iy in⁴",
            "col_ix": "Ix in⁴",
        },
        inplace=True,
    )
    return df

class Parametrization(vkt.Parametrization):
    step_1 = vkt.Step("Step 1 - Input Your Data!")
    step_1.intro = vkt.Text("""
# STAAD Design Ratio Analyzer
This app allows you to visualize a heat map from your STAAD.PRO model results.
You can filter and group them based on cross sections and visualize how they are distributed.""")
    step_1.table_input = vkt.Text("""
## 1.0 Create the Input Table!
Paste the design ratio data from your STAAD.PRO model!""")

    step_1.table = vkt.Table("### Beam Design Analysis")
    step_1.table.col_beam = vkt.TextField("Beam")
    step_1.table.col_analysis_property = vkt.TextField("Analysis Property")
    step_1.table.col_design_property = vkt.TextField("Design Property")
    step_1.table.col_actual_ratio = vkt.NumberField("Actual Ratio")
    step_1.table.col_allowable_ratio = vkt.NumberField("Allowable Ratio")
    step_1.table.col_normalized_ratio = vkt.NumberField("Normalized Ratio")
    step_1.table.col_clause = vkt.TextField("Clause")
    step_1.table.col_load_case = vkt.TextField("L/C")
    step_1.table.col_ax = vkt.TextField("Ax in²")
    step_1.table.col_iz = vkt.TextField("Iz in⁴")
    step_1.table.col_iy = vkt.TextField("Iy in⁴")
    step_1.table.col_ix = vkt.TextField("Ix in⁴")

    step_2 = vkt.Step("Step 2 - Post-Processing")
    step_2.process = vkt.Text("""
## 2.0 Filter and Group
Group or filter by a specific cross section.
Use the options below to customize your view.
If you want to list all cross-sections after selecting one, you can select the "All" option!
""")
    step_2.group = vkt.BooleanField("### Group by Cross-Section")
    step_2.ln_break = vkt.LineBreak()
    step_2.cross_section = vkt.OptionField(
        "### Filter by Cross-Section", options=["Empty Options"]
    )

class Controller(vkt.Controller):
    parametrization = Parametrization()
How this works
-
At the top of the file, we import
pandas, which we'll use to manipulate the data. -
The function
generate_dataframeconverts the table data from theParametrizationinto aDataFrameand renames the columns to more readable names. -
This function returns the
DataFrame, which will be used later to process and visualize the data.
4. Allow user selection of cross-sections
Now that we have implemented the generate_dataframe function, we can use the resulting DataFrame to create a list of cross sections. To do this, we can get the unique cross-section names from the "Design Property" column and convert them into a list. This list will be used in our OptionField. You can update the code as shown in the code snippet below!
import viktor as vkt
import pandas as pd

def generate_dataframe(table_data):
    df = pd.DataFrame([dict(item) for item in table_data])
    df.rename(
        columns={
            "col_beam": "Beam",
            "col_analysis_property": "Analysis Property",
            "col_design_property": "Design Property",
            "col_actual_ratio": "Actual Ratio",
            "col_allowable_ratio": "Allowable Ratio",
            "col_normalized_ratio": "Normalized Ratio (Actual/Allowable)",
            "col_clause": "Clause",
            "col_load_case": "L/C",
            "col_ax": "Ax in²",
            "col_iz": "Iz in⁴",
            "col_iy": "Iy in⁴",
            "col_ix": "Ix in⁴",
        },
        inplace=True,
    )
    return df

def get_cross_sections(params, **kwargs):
    if params.step_1.table:
        df = generate_dataframe(params.step_1.table)
        secs = df["Design Property"].unique().tolist()
        secs.append("All")
        return secs
    return ["No data available! Please add table input."]

class Parametrization(vkt.Parametrization):
    step_1 = vkt.Step("Step 1 - Input Your Data!")
    step_1.intro = vkt.Text("""
# STAAD Design Ratio Analyzer
This app allows you to visualize a heat map from your STAAD.PRO model results.
You can filter and group them based on cross sections and visualize how they are distributed.""")
    step_1.table_input = vkt.Text("""
## 1.0 Create the Input Table!
Paste the design ratio data from your STAAD.PRO model!""")

    step_1.table = vkt.Table("### Beam Design Analysis")
    step_1.table.col_beam = vkt.TextField("Beam")
    step_1.table.col_analysis_property = vkt.TextField("Analysis Property")
    step_1.table.col_design_property = vkt.TextField("Design Property")
    step_1.table.col_actual_ratio = vkt.NumberField("Actual Ratio")
    step_1.table.col_allowable_ratio = vkt.NumberField("Allowable Ratio")
    step_1.table.col_normalized_ratio = vkt.NumberField("Normalized Ratio")
    step_1.table.col_clause = vkt.TextField("Clause")
    step_1.table.col_load_case = vkt.TextField("L/C")
    step_1.table.col_ax = vkt.TextField("Ax in²")
    step_1.table.col_iz = vkt.TextField("Iz in⁴")
    step_1.table.col_iy = vkt.TextField("Iy in⁴")
    step_1.table.col_ix = vkt.TextField("Ix in⁴")

    step_2 = vkt.Step("Step 2 - Post-Processing")
    step_2.process = vkt.Text("""
## 2.0 Filter and Group
Group or filter by a specific cross section.
Use the options below to customize your view.
If you want to list all cross-sections after selecting one, you can select the "All" option!
""")
    step_2.group = vkt.BooleanField("### Group by Cross-Section")
    step_2.ln_break = vkt.LineBreak()
    step_2.cross_section = vkt.OptionField(
        "### Filter by Cross-Section", options=get_cross_sections
    )

class Controller(vkt.Controller):
    parametrization = Parametrization()
How this works
-
The
get_cross_sectionsfunction reads the DataFrame and extracts the unique values from the 'Design Property' column. -
These unique cross-sections are returned as a list to be used as options in the
cross_sectionOptionField. We also append "All" to the list to allow viewing all cross sections. -
By setting
options=get_cross_sectionsin theOptionField, we fill the field with the cross sections from the data (if there is data input).
5. Visualize design ratios with VIKTOR
After the user inputs data into the vkt.Table, we want to create clear visualizations and add functionality to the vkt.BooleanField and vkt.OptionField for grouping and filtering.
To do this, we will add a TableView that shows the design ratios in a table, sorted and colored based on their values. The logic for this will be implemented in the table_design_ratios method inside the Controller class.
In addition, we will use a complementary function called get_cell_color to assign a color based on the design ratio values. This will allow us to create a heatmap within the table.
Copy the highlighted piece of code and add it to app.py.
import viktor as vkt
import pandas as pd

def generate_dataframe(table_data):
    df = pd.DataFrame([dict(item) for item in table_data])
    df.rename(
        columns={
            "col_beam": "Beam",
            "col_analysis_property": "Analysis Property",
            "col_design_property": "Design Property",
            "col_actual_ratio": "Actual Ratio",
            "col_allowable_ratio": "Allowable Ratio",
            "col_normalized_ratio": "Normalized Ratio (Actual/Allowable)",
            "col_clause": "Clause",
            "col_load_case": "L/C",
            "col_ax": "Ax in²",
            "col_iz": "Iz in⁴",
            "col_iy": "Iy in⁴",
            "col_ix": "Ix in⁴",
        },
        inplace=True,
    )
    return df

def get_cross_sections(params, **kwargs):
    if params.step_1.table:
        df = generate_dataframe(params.step_1.table)
        secs = df["Design Property"].unique().tolist()
        secs.append("All")
        return secs
    return ["No data available! Please add table input."]

class Parametrization(vkt.Parametrization):
    step_1 = vkt.Step("Step 1 - Input Your Data!")
    step_1.intro = vkt.Text("""
# STAAD Design Ratio Analyzer
This app allows you to visualize a heat map from your STAAD.PRO model results.
You can filter and group them based on cross sections and visualize how they are distributed.""")
    step_1.table_input = vkt.Text("""
## 1.0 Create the Input Table!
Paste the design ratio data from your STAAD.PRO model!""")

    step_1.table = vkt.Table("### Beam Design Analysis")
    step_1.table.col_beam = vkt.TextField("Beam")
    step_1.table.col_analysis_property = vkt.TextField("Analysis Property")
    step_1.table.col_design_property = vkt.TextField("Design Property")
    step_1.table.col_actual_ratio = vkt.NumberField("Actual Ratio")
    step_1.table.col_allowable_ratio = vkt.NumberField("Allowable Ratio")
    step_1.table.col_normalized_ratio = vkt.NumberField("Normalized Ratio")
    step_1.table.col_clause = vkt.TextField("Clause")
    step_1.table.col_load_case = vkt.TextField("L/C")
    step_1.table.col_ax = vkt.TextField("Ax in²")
    step_1.table.col_iz = vkt.TextField("Iz in⁴")
    step_1.table.col_iy = vkt.TextField("Iy in⁴")
    step_1.table.col_ix = vkt.TextField("Ix in⁴")

    step_2 = vkt.Step("Step 2 - Post-Processing", views=["table_design_ratios"])
    step_2.process = vkt.Text("""
## 2.0 Filter and Group
Group or filter by a specific cross section.
Use the options below to customize your view.
If you want to list all cross-sections after selecting one, you can select the "All" option!
""")
    step_2.group = vkt.BooleanField("### Group by Cross-Section")
    step_2.ln_break = vkt.LineBreak()
    step_2.cross_section = vkt.OptionField(
        "### Filter by Cross-Section", options=get_cross_sections
    )

class Controller(vkt.Controller):
    parametrization = Parametrization()

    @vkt.TableView(label="Design Ratios by Cross Section")
    def table_design_ratios(self, params, **kwargs):
        if not params.step_1.table or len(params.step_1.table) == 0:
            return vkt.TableResult([["No data available! Please add table input."]])

        df = generate_dataframe(params.step_1.table)

        # Group or filter the data based on user selection
        if params.step_2.group:
            # For each cross section, get the row with the maximum normalized ratio
            df = df.loc[
                df.groupby("Design Property")[
                    "Normalized Ratio (Actual/Allowable)"
                ].idxmax()
            ].reset_index(drop=True)
        if params.step_2.cross_section and params.step_2.cross_section != "All":
            df = df[df["Design Property"] == params.step_2.cross_section]

        # Drop unnecessary columns
        df.drop(
            ["Ax in²", "Iz in⁴", "Iy in⁴", "Ix in⁴", "Analysis Property", "Clause"],
            axis=1,
            inplace=True,
        )

        # Sort the DataFrame by Normalized Ratio in descending order
        df.sort_values(
            by="Normalized Ratio (Actual/Allowable)", ascending=False, inplace=True
        )

        # Create table data with color-coded cells
        data = []
        for _, row in df.iterrows():
            ratio = row["Normalized Ratio (Actual/Allowable)"]
            color = self.get_cell_color(ratio)
            row_data = row.tolist()
            row_data[4] = vkt.TableCell(ratio, background_color=color)
            data.append(row_data)

        return vkt.TableResult(
            data, column_headers=df.columns.tolist(), enable_sorting_and_filtering=True
        )

    def get_cell_color(self, ratio):
        if ratio >= 1:
            return vkt.Color(210, 0, 0)  # Red
        elif ratio >= 0.85:
            return vkt.Color(255, 165, 0)  # Orange
        else:
            return vkt.Color(0, 210, 0)  # Green
How this works
-
We added the
table_design_ratiosmethod decorated with@vkt.TableView, which returns aTableResultto be displayed in the app. -
We specified
views=["table_design_ratios"]instep_2, so theTableViewwill appear in Step 2. -
We check if there's data available; if not, we return a message indicating that to the user.
-
Depending on the user's selection of
groupandcross_section, we group or filter the DataFrame.-
If
groupis selected, we group the data by "Design Property" and keep the row with the maximum "Normalized Ratio (Actual/Allowable)" for each group. -
If a
cross_sectionis selected and it's not "All", we filter the DataFrame to only include that cross-section.
-
-
We drop unnecessary columns to keep the table clean.
-
We sort the DataFrame by "Normalized Ratio (Actual/Allowable)" in descending order.
-
For each row, we create a
TableCellfor the "Normalized Ratio" column, setting the background color based on the value using theget_cell_colorfunction. -
The
get_cell_colorfunction determines the color based on the ratio value:-
Ratios >= 1 are colored red (overutilized)
-
Ratios >= 0.85 and < 1 are colored orange (approaching maximum capacity)
-
Ratios < 0.85 are colored green (underutilized)
-
The resulting app
Refresh your app in the browser. You will now see the table view appear in Step 2 of your app. For testing, feel free to copy the rows of the TXT file from section 3, then create a new row in the table. Click the top-left checkbox, press Ctrl + V, and you will see your rows being populated. After that, you can choose to group or filter the results by cross-section and analyze them.
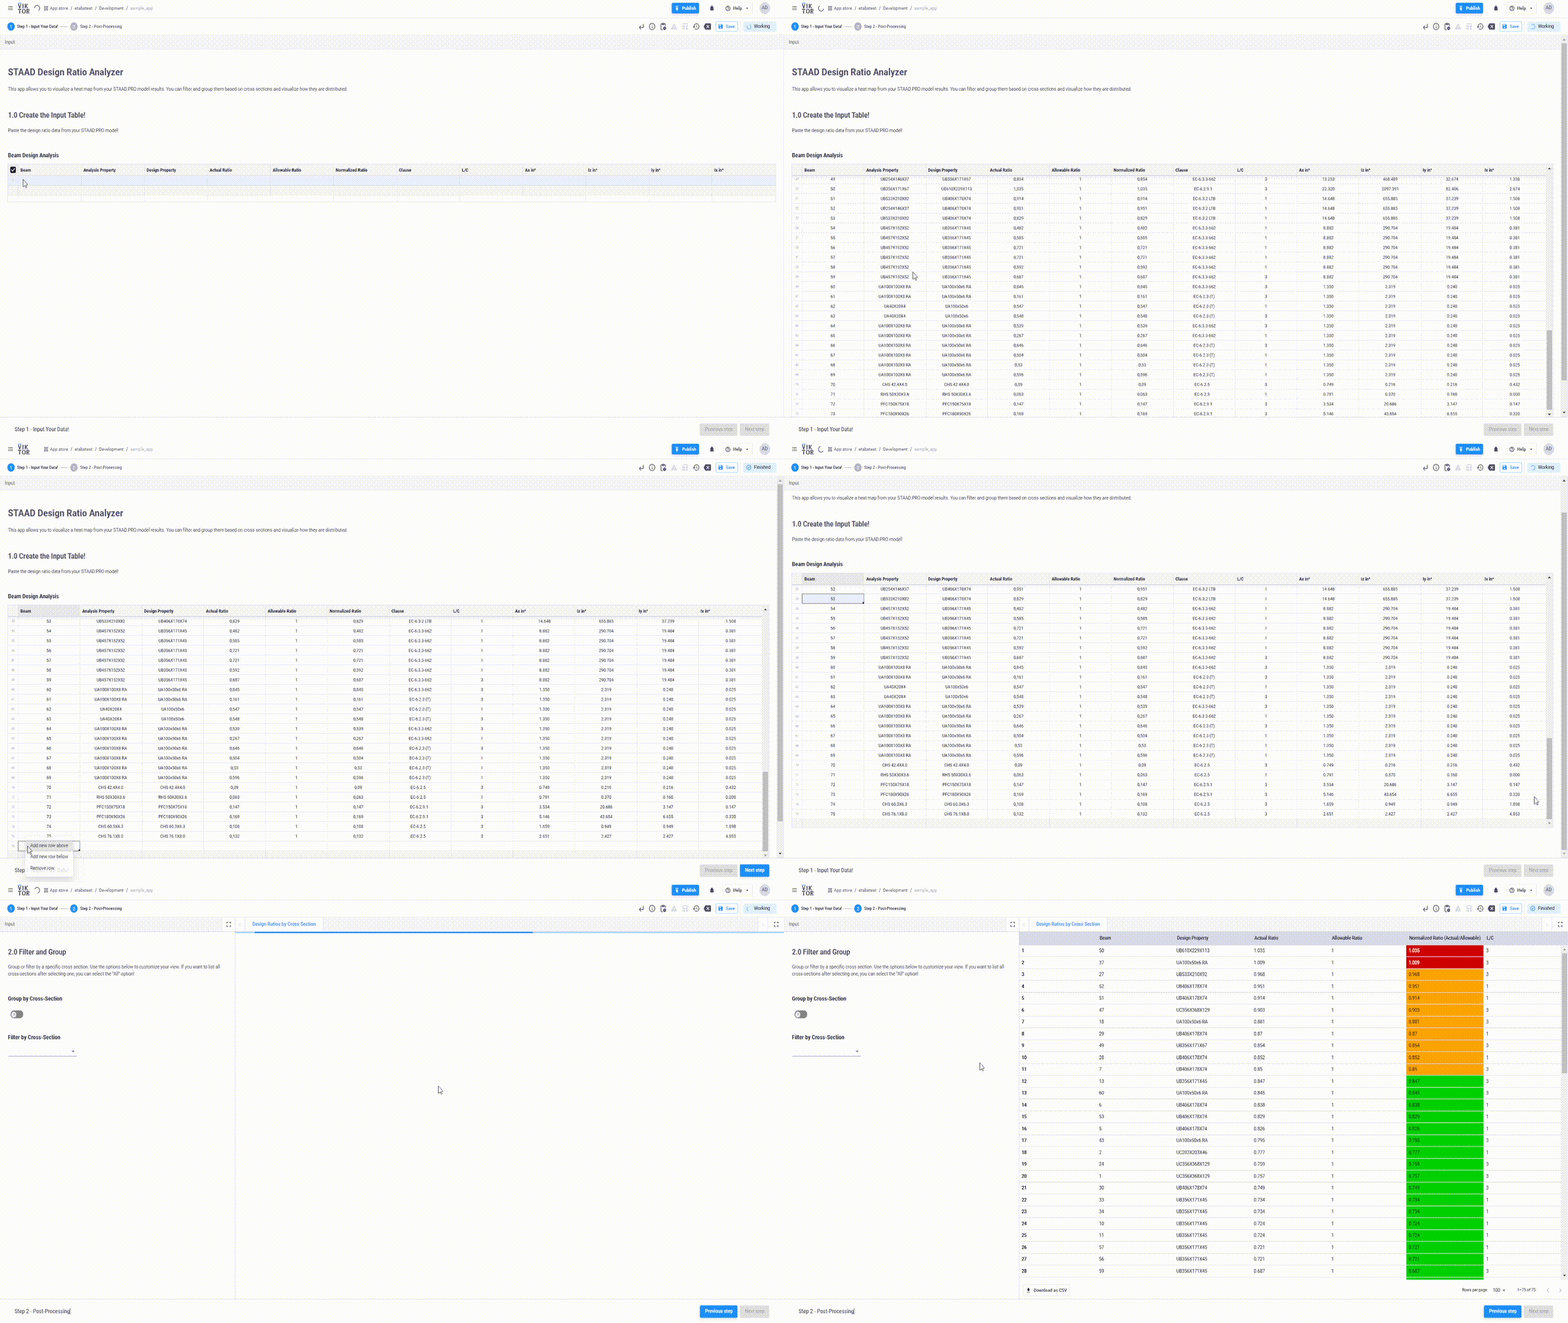
Ensure that there are no empty rows in the vkt.Table; otherwise, the app will complain. You can right-click on an empty row and delete it.
You can use the "Group by Cross-Section" toggle to view the maximum design ratios for each cross-section. Alternatively, you can use the "Filter by Cross-Section" dropdown to focus on a specific cross-section and see how its design ratios are distributed. This provides flexibility in analyzing the data based on your needs.
Complete code
Were you able to do everything in this tutorial without error? If not, you can always look at the full code:
import viktor as vkt
import pandas as pd

def generate_dataframe(table_data):
    df = pd.DataFrame([dict(item) for item in table_data])
    df.rename(
        columns={
            "col_beam": "Beam",
            "col_analysis_property": "Analysis Property",
            "col_design_property": "Design Property",
            "col_actual_ratio": "Actual Ratio",
            "col_allowable_ratio": "Allowable Ratio",
            "col_normalized_ratio": "Normalized Ratio (Actual/Allowable)",
            "col_clause": "Clause",
            "col_load_case": "L/C",
            "col_ax": "Ax in²",
            "col_iz": "Iz in⁴",
            "col_iy": "Iy in⁴",
            "col_ix": "Ix in⁴",
        },
        inplace=True,
    )
    return df

def get_cross_sections(params, **kwargs):
    if params.step_1.table:
        df = generate_dataframe(params.step_1.table)
        secs = df["Design Property"].unique().tolist()
        secs.append("All")
        return secs
    return ["No data available! Please add table input."]

class Parametrization(vkt.Parametrization):
    step_1 = vkt.Step("Step 1 - Input Your Data!")
    step_1.intro = vkt.Text("""
# STAAD Design Ratio Analyzer
This app allows you to visualize a heat map from your STAAD.PRO model results.
You can filter and group them based on cross sections and visualize how they are distributed.""")
    step_1.table_input = vkt.Text("""
## 1.0 Create the Input Table!
Paste the design ratio data from your STAAD.PRO model!""")

    step_1.table = vkt.Table("### Beam Design Analysis")
    step_1.table.col_beam = vkt.TextField("Beam")
    step_1.table.col_analysis_property = vkt.TextField("Analysis Property")
    step_1.table.col_design_property = vkt.TextField("Design Property")
    step_1.table.col_actual_ratio = vkt.NumberField("Actual Ratio")
    step_1.table.col_allowable_ratio = vkt.NumberField("Allowable Ratio")
    step_1.table.col_normalized_ratio = vkt.NumberField("Normalized Ratio")
    step_1.table.col_clause = vkt.TextField("Clause")
    step_1.table.col_load_case = vkt.TextField("L/C")
    step_1.table.col_ax = vkt.TextField("Ax in²")
    step_1.table.col_iz = vkt.TextField("Iz in⁴")
    step_1.table.col_iy = vkt.TextField("Iy in⁴")
    step_1.table.col_ix = vkt.TextField("Ix in⁴")

    step_2 = vkt.Step("Step 2 - Post-Processing", views=["table_design_ratios"])
    step_2.process = vkt.Text("""
## 2.0 Filter and Group
Group or filter by a specific cross section.
Use the options below to customize your view.
If you want to list all cross-sections after selecting one, you can select the "All" option!
""")
    step_2.group = vkt.BooleanField("### Group by Cross-Section")
    step_2.ln_break = vkt.LineBreak()
    step_2.cross_section = vkt.OptionField(
        "### Filter by Cross-Section", options=get_cross_sections
    )

class Controller(vkt.Controller):
    parametrization = Parametrization()

    @vkt.TableView(label="Design Ratios by Cross Section")
    def table_design_ratios(self, params, **kwargs):
        if not params.step_1.table or len(params.step_1.table) == 0:
            return vkt.TableResult([["No data available! Please add table input."]])

        df = generate_dataframe(params.step_1.table)

        # Group or filter the data based on user selection
        if params.step_2.group:
            # For each cross section, get the row with the maximum normalized ratio
            df = df.loc[
                df.groupby("Design Property")[
                    "Normalized Ratio (Actual/Allowable)"
                ].idxmax()
            ].reset_index(drop=True)
        if params.step_2.cross_section and params.step_2.cross_section != "All":
            df = df[df["Design Property"] == params.step_2.cross_section]

        # Drop unnecessary columns
        df.drop(
            ["Ax in²", "Iz in⁴", "Iy in⁴", "Ix in⁴", "Analysis Property", "Clause"],
            axis=1,
            inplace=True,
        )

        # Sort the DataFrame by Normalized Ratio in descending order
        df.sort_values(
            by="Normalized Ratio (Actual/Allowable)", ascending=False, inplace=True
        )

        # Create table data with color-coded cells
        data = []
        for _, row in df.iterrows():
            ratio = row["Normalized Ratio (Actual/Allowable)"]
            color = self.get_cell_color(ratio)
            row_data = row.tolist()
            row_data[4] = vkt.TableCell(ratio, background_color=color)
            data.append(row_data)

        return vkt.TableResult(
            data, column_headers=df.columns.tolist(), enable_sorting_and_filtering=True
        )

    def get_cell_color(self, ratio):
        if ratio >= 1:
            return vkt.Color(210, 0, 0)  # Red
        elif ratio >= 0.85:
            return vkt.Color(255, 165, 0)  # Orange
        else:
            return vkt.Color(0, 210, 0)  # Green
Export your own results from STAAD.PRO
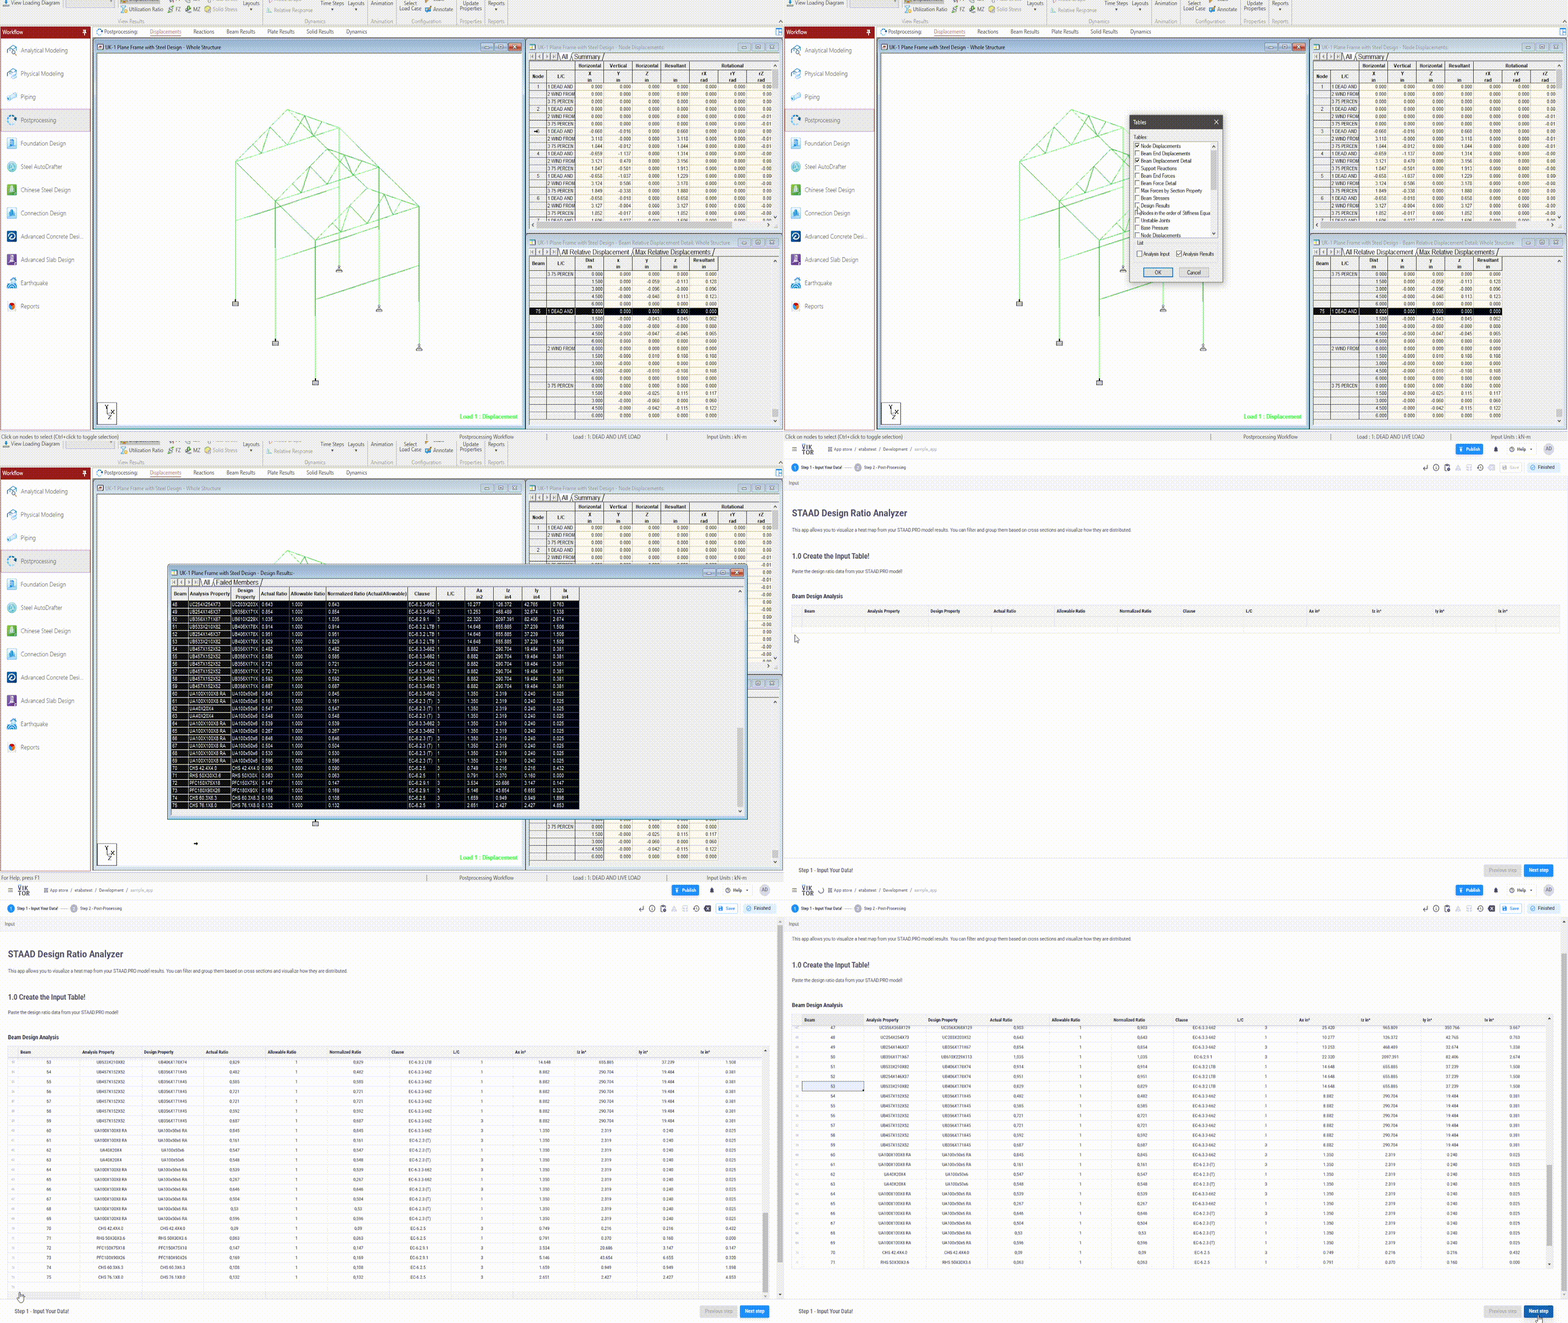
To export the design ratios from your STAAD.PRO app, first run your analysis and design check. Then, right-click > Tables > Design Results, and simply copy and paste the data into the vkt.Table component in the app. Make sure there are no empty rows, and you are all set!
You can see how this process works in the animation below.
What's next?
In this tutorial, you learned how to post-process results exported from STAAD.PRO. Your next goal could be to implement automation using the STAAD.PRO API from your VIKTOR app. To achieve this, the best place to start is the following tutorial.