Tutorial - Create an interactive map
Level: Beginners
Time: 20 min
Prerequisites:
- You have an account and completed the installation process. No account? Get one here
- You have some experience with reading Python code

Introduction
Welcome to this tutorial on how to create a web app that displays data on map, using VIKTOR and Python!
As an engineer or data scientist, you may work with geo-located data. Visualizing this on a map is probably the best way to make this data insightful!
In this tutorial, we will explore how to visualize points, lines, and polygons in a map with VIKTOR and python. We will also see how you can make this map interactive and ask users to provide a location. We will cover:
- Create an empty app template
- Adding a map
- Showing data on the map
- Let's make it interactive!
- Using custom markers and colors
By the end of this tutorial you will be able to place points, lines and polygons in a VIKTOR app and have a basic understanding of how you can use maps to enhance your visuals! It will look similar to the gif below:
1. Create app folder
Is your app code giving you an error? Take a look at the complete app code.
Also know that you can always ask help at our Community Forum, where our developer are ready to help with any question related to the installation, coding and more.
When developing app, you store the code on your hard drive. So let's create some folders to store the code.
-
If you haven't yet, create a folder called
viktor-appsto store all your apps. Let's do this inside your user folder, like shown here:C:\Users\<username>\viktor-appsLINUX
Are you a Linux user? Then make sure the CLI has full rights in the apps directory, by changing its permissions with:
sudo chmod -R 777 ~/viktor-apps -
Inside
viktor-apps, make another folder calledmap-tutorialfor this project:C:\Users\<username>\viktor-apps\map-tutorial
2. Create, install and start an empty app
Let's now create, install and start a blank app template. We will use the blank template to create our map viewer app.
But before we start, make sure to shut down any app that is running (like the demo app) by closing the command-line shell
(for example Powershell) or cancel the process using Ctrl + C.
Follow these steps to create, install and start a blank app template:
-
Open your preferred code editor (e.g. PyCharm, VS Code, etc.).
-
Click File -> Open, and open the folder
map-tutorialwe created before as a new project. -
Inside your code editor, open the terminal. The keyboard shortcut to open a terminal in PyCharm is
Alt + F12and in VS CodeCtrl+Shift+` -
In the terminal, use the command shown below to create empty app template files inside the folder
map-tutorialviktor-cli create-app --app-type editor -
Now we'll install your app and all its dependencies (including
plotlyandpandas) by running this command in the terminal. Just be patient, this could take up to 5 minutes... Maybe it's time for a ☕?viktor-cli clean-startIf all went well, your empty app is installed and running one your development workspace. Do not close the terminal as this will break the connection with your app.
You can see your app which you can see by visiting the URL shown in the terminal (for example https://cloud.viktor.ai)
Your terminal should show something like this:
 INFO     : Connecting to platform...
 INFO     : Connection is established: https://cloud.viktor.ai  <---- here you can see your app
 INFO     : The connection can be closed using Ctrl+C
 INFO     : App is ready
- You only need create an app template and install it once for each new app you want to make.
- The app will update automatically once you start adding code in
app.py, as long as you don't close the terminal or your code editor. - Did you close your code editor? Use
viktor-cli startto start the app again. No need to install, clear, etc.
Did it not work because you got an error messages?
Some troubleshooting
-
Always make sure to check the spelling of everything you placed in the command-line, a small mistake and the command you are trying to run may not be recognised!
-
If you are encountering:
ERROR:
  Exiting because of an error: no requirements.txt file
PS C:\Users\<username>\viktor-apps>
Then you are not in the correct folder! check the command-line and navigate to the map-tutorial folder.
-
If you are encountering:
Error: App definition is not compatible with the data currently stored in the database. Use the command 'viktor-cli clear' to clear the database.
PS C:\Users\<username>\viktor-apps\map-tutorial>
That means you have not cleared the database yet! Use the
viktor-cli clearto clear and then you can useviktor-cli startto start the app. No need to install it again!
Not seeing any of these errors? Head over to our community! There is a good chance another developer encountered it and solved it too!
3. Adding a map
The app we will be making during this tutorial will display flight paths for air traffic. It will also include functionality for visualizing a no-flight zone.
To begin, we will add the map to our app using a MapView. Remember that we always add views in the
Controller class.
We will also create a list called features, containing everything we want to show on the map. The list is empty for
now, but we will fill it in the following steps.
- Open
app.pyand make sure your code looks like this. Notice that all the required import statements are already included. This will save us some back-and-forth along the way. If you like you can use the searchbar on the top-right of this page to get some more information on those features:
from viktor import ViktorController
from viktor.parametrization import ViktorParametrization, GeoPointField, Text
from viktor.views import MapPolygon, MapResult, MapPoint, MapView, MapLine, Color
class Parametrization(ViktorParametrization):
pass
class Controller(ViktorController):
label = 'My Map App'
parametrization = Parametrization
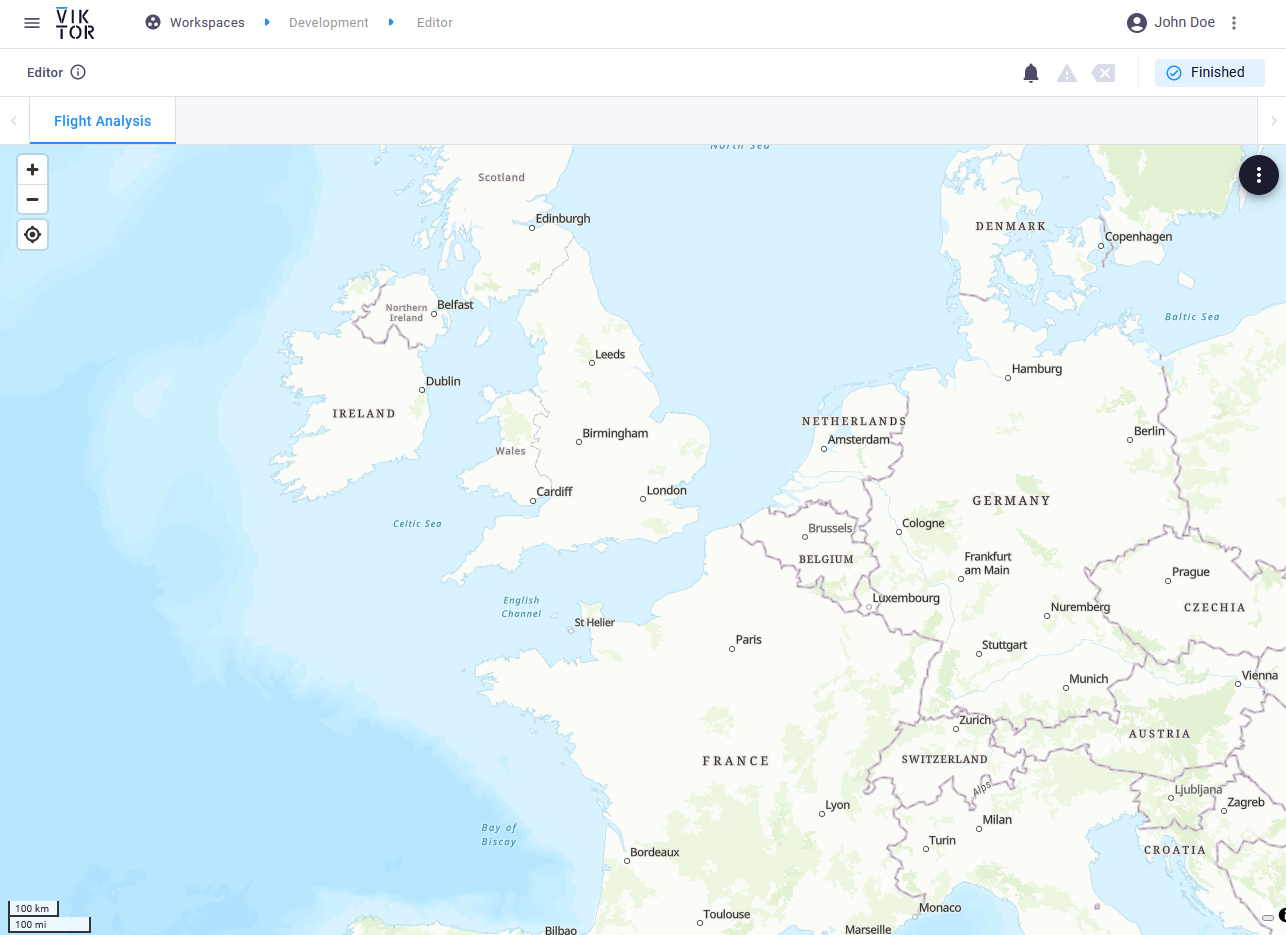
@MapView('Flight Analysis', duration_guess=1)
def generate_map(self, params, **kwargs):
features = []
return MapResult(features)
-
Go to your cloud environment (e.g. cloud.viktor.ai) and open the development card. Great! You will be able to see the map.
4. Showing data on the map
We will draw a polygon on the map to mark the no-fly zone using MapPolygon. To create
this polygon, we must first define its corner using MapPoints.
-
Go to
app.pyand modify the code under theMapViewso it looks like this:@MapView('Flight Analysis', duration_guess=1)
def generate_map(self, params, **kwargs):
features = []
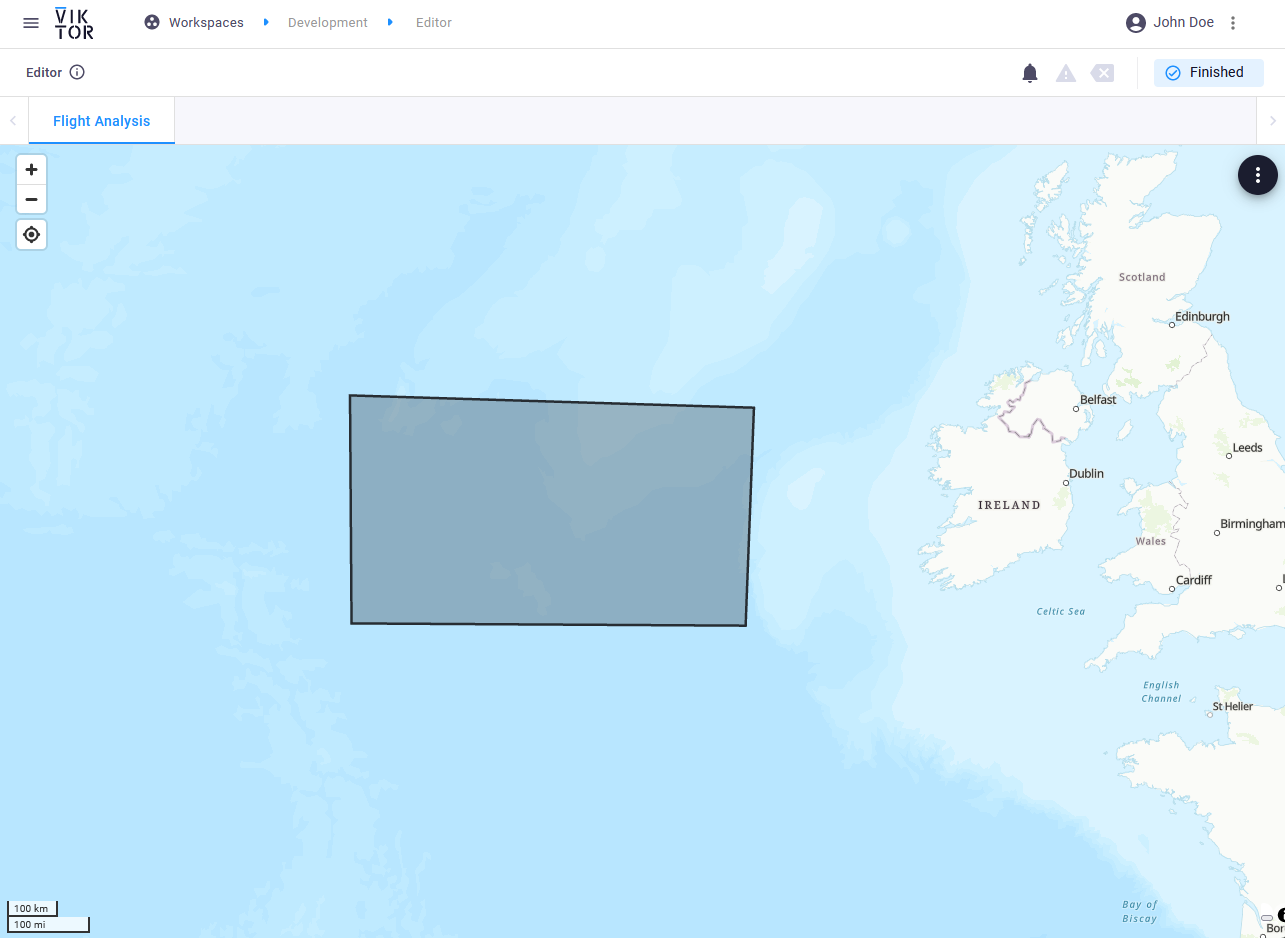
# Draw no-fly zone
no_fly_zone = MapPolygon([
MapPoint(54.814614, -26.785331),
MapPoint(54.610949, -15.190123),
MapPoint(50.824269, -15.429211),
MapPoint(50.864828, -26.741683)],
)
features.append(no_fly_zone)
return MapResult(features) -
Go to your app in the browser and refresh the page. Awesome! You should now be able to see the no-fly zone we just made
5. Let's make it interactive!
In this part of the tutorial, we will add some interactivity. We will define a flight path by letting the user choose the departing and arriving airport by clicking on the map!
We will do this using GeoPointField. We just want to let you know that there
is also GeoPolylineField and GeoPolygonField
that you can use in your app.
Also, we will add a Text description that helps the users understand what they need to do.
-
Under your
Parametrizationclass add these fields, and don’t forget to deletepass:...
class Parametrization(ViktorParametrization):
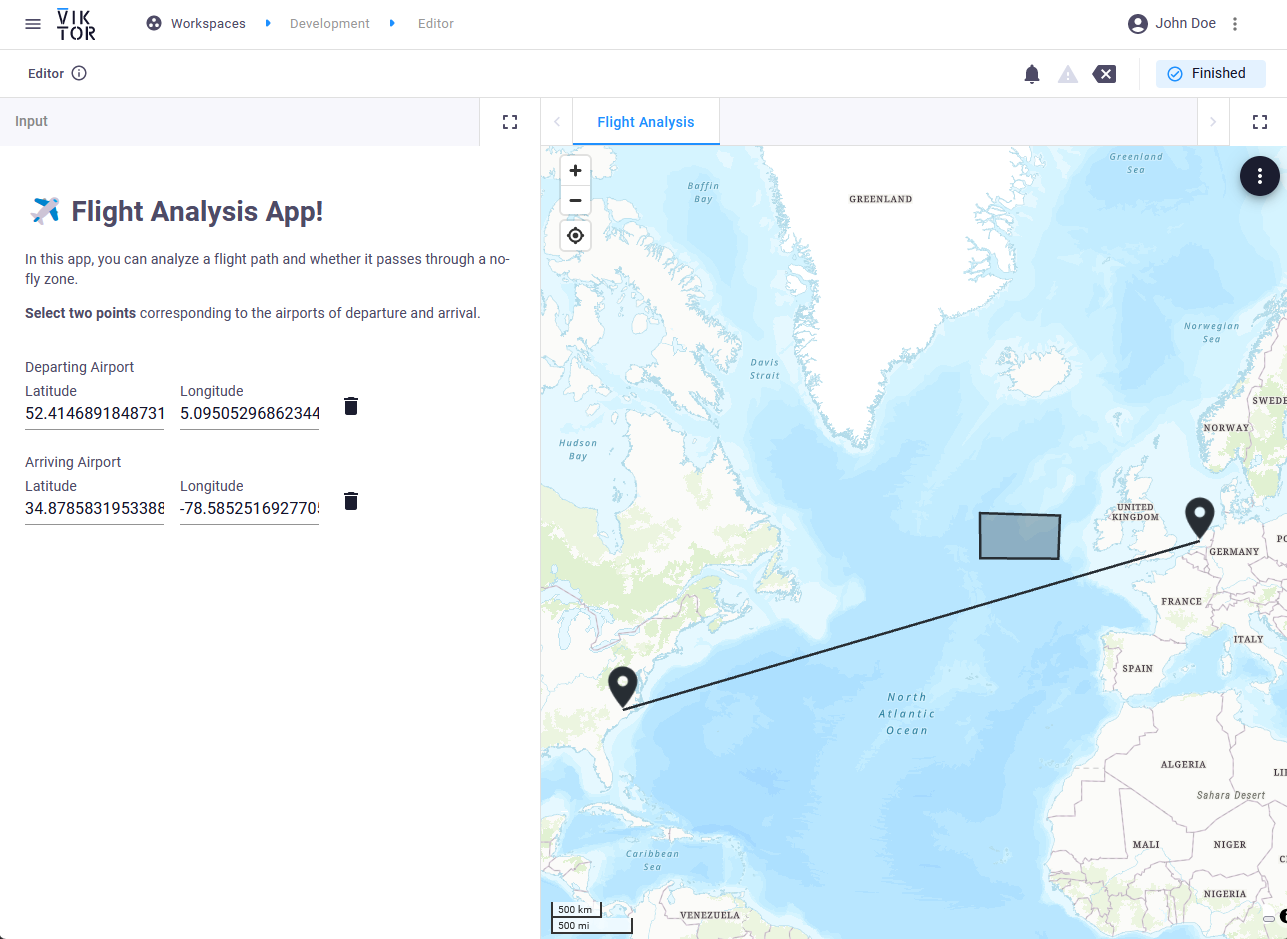
intro = Text("""
# ✈️ Flight Analysis App!
In this app, you can analyze a flight path and whether it passes through a no-fly zone.
**Select two points** corresponding to the airports of departure and arrival.
""")
dep_airport = GeoPointField('Departing Airport')
arr_airport = GeoPointField('Arriving Airport') -
Refresh the app and take a look. You will notice the new
GeoFieldsand the description. Give them a try. -
Maybe you already noticed this, but the markers disappear after clicking the map. To solve the problem, let’s add the points to our
featureslist in theMapViewlist.Note that we will add an
if-statementbefore adding them so the app does not give an error when the user hasn't clicked on the map yet (e.g.params.dep_airport = None)Under the line
features.append(no_fly_zone)add:...
features.append(no_fly_zone) # <--- this line is for your reference
if params.dep_airport:
dep_point = MapPoint.from_geo_point(params.dep_airport)
features.append(dep_point)
if params.arr_airport:
arr_point = MapPoint.from_geo_point(params.arr_airport)
features.append(arr_point) -
Since we are looking to analyze the flight, we also need to add a flight path. Let’s connect the dots 😉. Under the lines we just added, add:
     if params.dep_airport and params.arr_airport:
         flight_path = MapLine(dep_point, arr_point)
features.append(flight_path) -
Refresh your app and take a look. Fantastic, you have now made an app to add flight paths to a map and see whether they enter a no-fly zone. You have done a great job! 🥳
6. But wait... there is more!
We made a beautiful app together, but let’s make it even better by adding some color, custom pins, and descriptive labels.
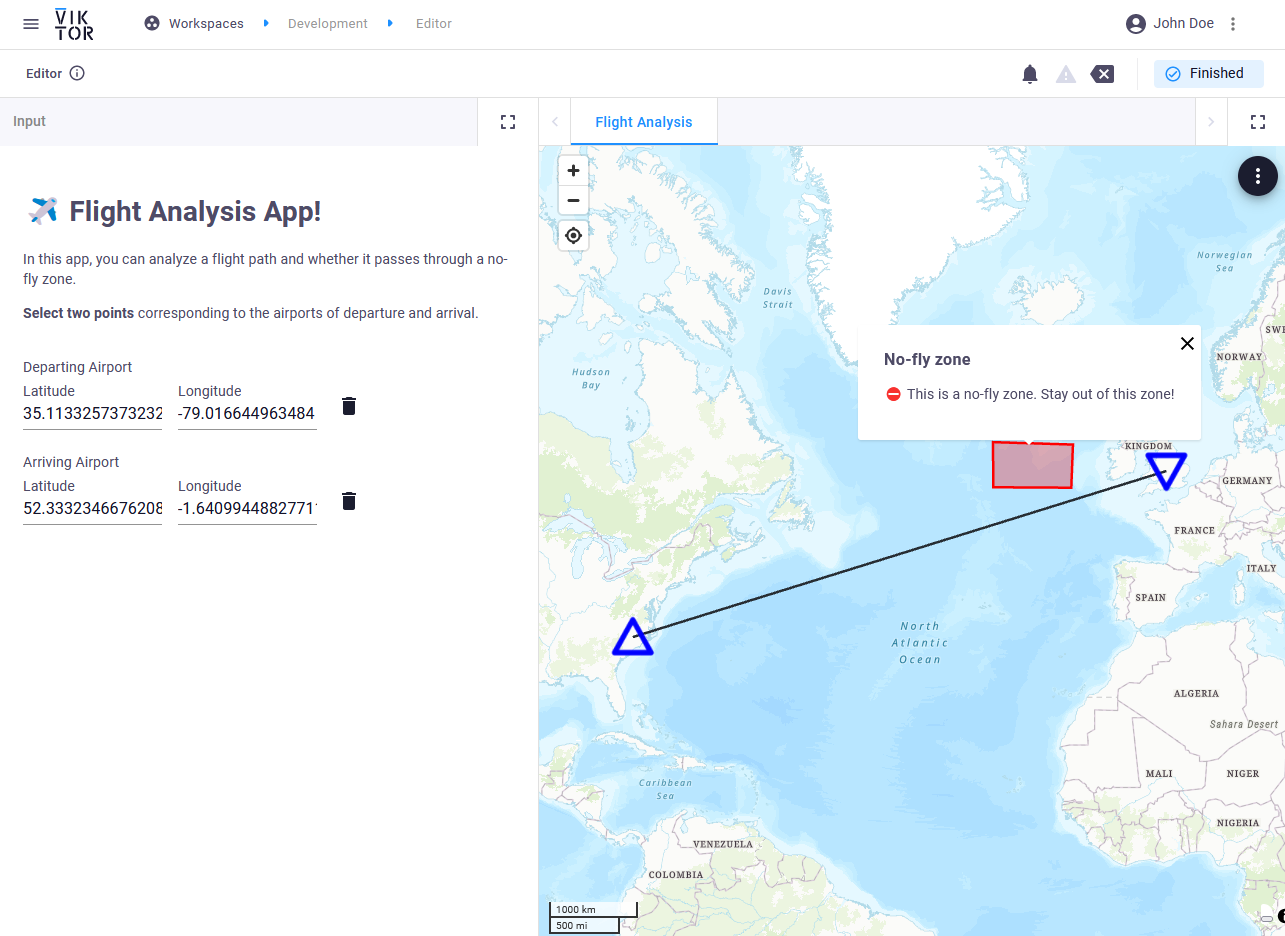
- Let’s make it clear that it is a no-fly zone by making it red and adding a description that the user will see when
clicking on the map. Do this by adding these lines of code where you define the
no_fly_zone:
no_fly_zone = MapPolygon([
   MapPoint(54.814614, -26.785331),
   MapPoint(54.610949, -15.190123),
   MapPoint(50.824269, -15.429211),
   MapPoint(50.864828, -26.741683)],
   color=Color.red(),                                                # <--- add this line
   title="No-fly zone",                                              # <--- add this line
   description="⛔ This is a no-fly zone. Stay out of this zone!"    # <--- add this line
)
-
We will make airport pins blue and change their icon. Find where we define
dep_pointandarr_pointand modify the code like this:dep_point = MapPoint.from_geo_point(params.dep_airport, icon='triangle', color=Color.blue())arr_point = MapPoint.from_geo_point(params.arr_airport, icon='triangle-down', color=Color.blue()) -
Refresh your app and play with it.
Congratulations! You made a wonderful interactive map and even personalized it by using custom icons and colors. You have done a great job and can be proud of yourself! 😎
By now, your app should look like this:
Complete app code
Were you able to do everything in this tutorial without error? If not, you can always take a look at the full code:
Complete code
from viktor import ViktorController
from viktor.parametrization import ViktorParametrization, GeoPointField, Text
from viktor.views import MapPolygon, MapResult, MapPoint, MapView, MapLine, Color


class Parametrization(ViktorParametrization):
    intro = Text("""
# ✈️ Flight Analysis App!

In this app, you can analyze a flight path and whether it passes through a no-fly zone.

**Select two points** corresponding to the airports of departure and arrival.
    """)

    dep_airport = GeoPointField('Departing Airport')
    arr_airport = GeoPointField('Arriving Airport')


class Controller(ViktorController):
    label = 'My Map App'
    parametrization = Parametrization

    @MapView('Flight Analysis', duration_guess=1)
    def generate_map(self, params, **kwargs):
        features = []

        # Draw no-fly zone

        no_fly_zone = MapPolygon([
            MapPoint(54.814614, -26.785331),
            MapPoint(54.610949, -15.190123),
            MapPoint(50.824269, -15.429211),
            MapPoint(50.864828, -26.741683)],
            color=Color.red(),
            title="No-fly zone",
            description="⛔ This is a no-fly zone. Stay out of this zone!"
        )

        features.append(no_fly_zone)

        # Draw airports

        if params.dep_airport:
            dep_point = MapPoint.from_geo_point(params.dep_airport, icon='triangle', color=Color.blue())
            features.append(dep_point)

        if params.arr_airport:
            arr_point = MapPoint.from_geo_point(params.arr_airport, icon='triangle-down', color=Color.blue())
            features.append(arr_point)

        # Draw flight path

        if params.dep_airport and params.arr_airport:
            flight_path = MapLine(dep_point, arr_point)
            features.append(flight_path)

        return MapResult(features)
Want to learn how VIKTOR works?
If you are interested in how VIKTOR works behind the scenes, for example how it processes your input, expand the tabs below!
How does it work?
How does the Parametrization work?
In the Parameterization class you can add input fields that allow the user to provide input to your app, and there are more than 20 different input fields you can use, including numbers, text, colors, images and files.
Inside the Parametrization class, you can also format the layout of your app by adding sections, tabs, steps and pages.
To show your Parametrization in the app, we need to add the line parametrization = Parametrization inside the
Controller class, because it is the controller that determines what is shown and not.
How does the Parametrization get saved?
So you may be wondering, how do you get the information from the parametrization to my controller?
Well, we do this automatically for you. The values of all parameters are stored in a single variable called params
, which is accessible inside the Controller class.
These variables are stored in a Munch; this is similar to a dictionary, but work with point denotation.
Example:
- Let's say we have a variable called
heightas a NumberField in ourParameterization. - To use it in a method in the
Controller, define it as:def my_method(self, params, **kwargs) - You can now make calculations inside that method using our height parameter as
params.height!
How does the Controller work?
The Controller class is the place where you add everything you want to calculate and show.
As explained in this tutorial, we show results in a View and we always add views in our controller.
You can even add several views in a single app by adding them to the controller class... and yes, we have
many Views,for showing graphs, maps, 3D models, reports, images and more.
In the Controller, you also do or call your calculation. Remember that the user input given in the parametrization,
is accessible inside the Controller class in the variable The params.
What's next
Very impressive! You have now learned the basics of the VIKTOR MapView. In this tutorial, we have only scratched the surface of what you can do using maps. So don’t stop your journey there!
If you like an extra challenge, here are some ideas:
- Make the no-fly zone interactive using a
GeoPolygonField - Make the flight path red when it crosses the no-fly zone and green when it doesn’t
- Create a flight path that passes several points using a
GeoPolylineField - Calculate the distance of the flight path and show it on the map
Or just follow some of our other tutorials
You can find more information about how to use maps in the maps guide. Also check more about input fields for maps