viktor.views
AutodeskResult
- class viktor.views.AutodeskResult(autodesk_file, *, access_token)
Bases:
_ViewResultNew in v14.25.0Container with the Autodesk cloud storage file that should be visualized in a AutodeskView.
- Parameters:
autodesk_file (
AutodeskFile|str) – Autodesk file to show. Can also pass the URN (unique resource name) of the versioned file on Autodesk cloud storage (of the form “urn:adsk.wipprod:fs.file:vf.XXX?version=Y”) directly.access_token (
str) – Autodesk cloud storage token to access the file.
AutodeskView
- class viktor.views.AutodeskView(label, duration_guess=None, *, description=None, update_label=None, visible=True, **kwargs)
Bases:
ViewNew in v14.25.0A decorator class that configures a controller method to return an Autodesk-specific view, utilizing the Autodesk API for content display.
Example usage:
@vkt.AutodeskView("Autodesk View") def get_autodesk_view(self, params, **kwargs): integration = vkt.external.OAuth2Integration("autodesk-integration") token = integration.get_access_token() autodesk_file = params.autodesk_file # value of AutodeskFileField if autodesk_file is None: raise vkt.UserError("Please select an Autodesk file") return vkt.AutodeskResult(autodesk_file, access_token=token)- Parameters:
label (
str) – Name which is shown on tab in interface. e.g: ‘3D Representation’duration_guess (
int) – Estimation of view calculation in seconds. This will be used to add a manual refresh button for long-running tasks (larger than 3s). This estimation does not need to be very precise, but the performance will be better if this is close to the real maximum computation time (defaults to 1).description (
str) – Show more information to the user through a tooltip on hover (max. 200 characters).update_label (
str) – Name which is shown on the update button in case of a slow view (max. 30 characters).visible (
bool|Callable) – Visibility of the view. Can depend on params by using a callback functionNew in v14.22.0
DataGroup
- class viktor.views.DataGroup(*args, **kwargs)
Bases:
dictContainer for DataItems (max. 100).
DataItems can be added with or without a keyword argument. Keywords are required when you want to use a DataItem in the summary (for lookup).
Example:
DataGroup(
    DataItem('a', 1),
    DataItem('b', 2),
    output_c=DataItem('c', 3),  # 'output_c' can be used in the entity summary
    output_d=DataItem('d', 4),  # 'output_d' can be used in the entity summary
)
(new in v14.22.0) Append items to an existing data group using DataGroup.add():
d = DataGroup( DataItem('a', 1), ) d.add(DataItem('b', 2)) d.add(DataItem('c', 3), DataItem('d', 4))- Parameters:
- Raises:
AttributeError when more than 100 DataItems are used
- add(*items)
- New in v14.22.0
Add one or more DataItems to an existing DataGroup.
- Return type:
None
- classmethod from_data_groups(groups)
Constructs a combined DataGroup object from a list of individual DataGroup entries.
Note that is not possible to have multiple DataGroups that share a specific key for a DataItem, e.g. the following will result in an error:
d1 = DataGroup(output_a=DataItem(...)) d2 = DataGroup(output_a=DataItem(...)) d3 = DataGroup.from_data_groups([d1, d2]) # raises KeyError- Return type:
DataItem
- class viktor.views.DataItem(label, value=None, subgroup=None, *, prefix='', suffix='', number_of_decimals=None, status=DataStatus.INFO, status_message='', explanation_label='')
-
Constructs an entry that can be used as input of a DataGroup, to fill the data view with results.
The data view is dynamic, which means that a DataItem itself can consist of another DataGroup as subgroup. Both examples are demonstrated below.
Example single entry:
result = "I am a great result"
item = DataItem('output 1', result)
Example subgroup:
result = "I am a great result"
item = DataItem('output 1', result, subgroup=DataGroup(
    output11=DataItem('output 1.1', "I can also be a numeric result"),
    output12=DataItem('output 1.2', 123)
))
The prefix / suffix can potentially change with every call. However, when the result is used in the Summary, the prefix / suffix of the DataItem should be equal to the prefix / suffix of the SummaryItem to maintain a consistent database.
- Parameters:
label (
str) – Description of the value which is shown. e.g: ‘Uc bending’value (
str|float) – Value of the data. e.g: 0.9subgroup (
DataGroup) – Optional DataItems grouped together in a DataGroup underneath this DataItem. Maximum depth = 3prefix (
str) – E.g: €. Should be equal to the prefix of the SummaryItem if linked.suffix (
str) – E.g: N. Should be equal to the suffix of the SummaryItem if linked.number_of_decimals (
int) – Number of decimals with which the value is rounded for display.status (
DataStatus) –Status of value. This controls the formatting of the status_message:
status=DataStatus.INFO: black text
status=DataStatus.SUCCESS: green text
status=DataStatus.WARNING: orange text
status=DataStatus.ERROR: red text
status_message (
str) – Message which will be shown underneath the value. Color can be formatted with status.explanation_label (
str) – Optional text which is placed between the label and the value. Could for instance be used for a calculation.
- Raises:
TypeError – if number_of_decimals is used on a non-numeric value.
DataResult
DataStatus
- class viktor.views.DataStatus(*values)
Bases:
EnumEnumeration of statuses to annotate a DataItem.
- ERROR:
DataStatus= 'error'
- INFO:
DataStatus= 'info'
- SUCCESS:
DataStatus= 'success'
- WARNING:
DataStatus= 'warning'
- ERROR:
DataView
- class viktor.views.DataView(label, duration_guess=None, *, description=None, update_label=None, visible=True, **kwargs)
Bases:
ViewFunction decorator to instruct the controller method to return a data view that contains calculation result.
Example usage:
@DataView("Cost breakdown")
def get_data_view(self, params, **kwargs):
    # calculate data
    ...
    return DataResult(data_group)
(new in v14.15.0) The ‘duration_guess’ argument is now optional.
- Parameters:
label (
str) – Name which is shown on tab in interface. e.g: ‘3D Representation’duration_guess (
int) – Estimation of view calculation in seconds. This will be used to add a manual refresh button for long-running tasks (larger than 3s). This estimation does not need to be very precise, but the performance will be better if this is close to the real maximum computation time (defaults to 1).description (
str) – Show more information to the user through a tooltip on hover (max. 200 characters).update_label (
str) – Name which is shown on the update button in case of a slow view (max. 30 characters).visible (
bool|Callable) – Visibility of the view. Can depend on params by using a callback functionNew in v14.22.0
GeoJSONAndDataResult
- class viktor.views.GeoJSONAndDataResult(geojson, data, labels=None, legend=None, *, interaction_groups=None)
Bases:
_ViewResultContainer with the GeoJSON data and result data that should be visualized in a GeoJSONAndDataView. Optionally a legend and map labels can be included.
- Parameters:
geojson (
dict) – GeoJSON dictionary.data (
DataGroup) – Result data.labels (
List[MapLabel]) – Labels that should be placed on the map.legend (
MapLegend) – Map legend.interaction_groups (
Dict[str,Sequence[int|str|MapFeature]]) – create named groups that can be referred to in a map interactionNew in v13.2.0
- property geojson: dict
GeoJSONAndDataView
- class viktor.views.GeoJSONAndDataView(label, duration_guess=None, *, description=None, update_label=None, visible=True, **kwargs)
Bases:
ViewFunction decorator to instruct the controller method to return a combined view consisting of a GeoJSON and data.
Example usage:
@vkt.GeoJSONAndDataView("Map / Data")
def get_geojson_data_view(self, params, **kwargs):
    ...
    return vkt.GeoJSONAndDataResult(...)
(new in v14.15.0) The ‘duration_guess’ argument is now optional.
- Parameters:
label (
str) – Name which is shown on tab in interface. e.g: ‘3D Representation’duration_guess (
int) – Estimation of view calculation in seconds. This will be used to add a manual refresh button for long-running tasks (larger than 3s). This estimation does not need to be very precise, but the performance will be better if this is close to the real maximum computation time (defaults to 1).description (
str) – Show more information to the user through a tooltip on hover (max. 200 characters).update_label (
str) – Name which is shown on the update button in case of a slow view (max. 30 characters).visible (
bool|Callable) – Visibility of the view. Can depend on params by using a callback functionNew in v14.22.0
GeoJSONResult
- class viktor.views.GeoJSONResult(geojson, labels=None, legend=None, *, interaction_groups=None)
Bases:
_ViewResultContainer with the GeoJSON data that should be visualized in a GeoJSONView. Optionally a legend and map labels can be included.
The following geojson properties are supported that can be used for styling of the map elements:
icon (geometry type ‘Point’ only): icon to be shown (default: “pin”). For a complete list of all available markers, see
MapPointmarker-color: the color of a marker [*]
description: text to show when this item is clicked
stroke: the color of a line as part of a polygon, polyline, or multigeometry *
fill: the color of the interior of a polygon *
To enable interaction, the map feature identifiers can be defined within the geojson dict by adding an “id” attribute to a feature as follows:
{ "type": "FeatureCollection", "features": [ { "type": "Feature", "properties": ..., "geometry": ... "id": "my identifier", ...- Parameters:
geojson (
dict) – GeoJSON dictionary.labels (
List[MapLabel]) – Labels that should be placed on the map.legend (
MapLegend) – Map legend.interaction_groups (
Dict[str,Sequence[int|str|MapFeature]]) – create named groups that can be referred to in a map interactionNew in v13.2.0
- property geojson: dict
GeoJSONView
- class viktor.views.GeoJSONView(label, duration_guess=None, *, description=None, update_label=None, visible=True, **kwargs)
Bases:
ViewFunction decorator to instruct the controller method to return a GeoJSON (geographic data) view.
Example usage:
@GeoJSONView("Map")
def get_geojson_view(self, params, **kwargs):
    ...
    return GeoJSONResult(...)
(new in v14.15.0) The ‘duration_guess’ argument is now optional.
- Parameters:
label (
str) – Name which is shown on tab in interface. e.g: ‘3D Representation’duration_guess (
int) – Estimation of view calculation in seconds. This will be used to add a manual refresh button for long-running tasks (larger than 3s). This estimation does not need to be very precise, but the performance will be better if this is close to the real maximum computation time (defaults to 1).description (
str) – Show more information to the user through a tooltip on hover (max. 200 characters).update_label (
str) – Name which is shown on the update button in case of a slow view (max. 30 characters).visible (
bool|Callable) – Visibility of the view. Can depend on params by using a callback functionNew in v14.22.0
GeometryAndDataResult
- class viktor.views.GeometryAndDataResult(geometry, data, labels=None, *, geometry_type='gltf')
Bases:
_ViewResultContainer with the results that should be visualized in a GeometryAndDataView. This consists of three-dimensional geometry object(s) with optional text labels and data.
Please have a look at GeometryResult for examples.
- Parameters:
geometry (
TransformableObject|Sequence[TransformableObject] |File|FileResource) – TransformableObject(s) that contain the geometric objects, or a geometry file such as glTF/GLB (v2.0) (https://en.wikipedia.org/wiki/GlTF).geometry_type (
str) – Type of loader that should be used to render the geometry (“gltf”, “3dm”)New in v14.4.0.data (
DataGroup) – Result data.labels (
List[Label]) – Text labels that can be used to provide additional information.
GeometryAndDataView
- class viktor.views.GeometryAndDataView(label, duration_guess=None, *, description=None, update_label=None, view_mode='3D', default_shadow=False, up_axis='Z', x_axis_to_right=None, visible=True)
Bases:
ViewFunction decorator to instruct the controller method to return a combined view consisting of geometries and data.
Example usage:
@GeometryAndDataView("Model / Cost")
def get_geometry_data_view(self, params, **kwargs):
    ...
    return GeometryAndDataResult(...)
(new in v14.15.0) The ‘duration_guess’ argument is now optional.
- Parameters:
label (
str) – SeeView.duration_guess (
int) – SeeView.description (
str) – SeeView.update_label (
str) – SeeView.view_mode (
Literal['2D','3D']) –Sets the view mode:
’3D’: Camera is free to move and user can choose between orthographic and perspective view.
’2D’: Camera is fixed on the xy-plane and view is orthographic.
default_shadow (
bool) – Show shadow when editor is opened. User can still switch it off.up_axis (
Literal['Y','Z']) – (view_mode=’3D’ only) Upwards pointing axis. Possible options: �‘Y’, ‘Z’ (default: ‘Z’)x_axis_to_right (
bool) – (view_mode=’3D’ and up_axis=’Y’ only) X-axis pointing to the right in the initial viewNew in v14.8.0visible (
bool|Callable) – Visibility of the view. Can depend on params by using a callback functionNew in v14.22.0
GeometryResult
- class viktor.views.GeometryResult(geometry, labels=None, *, geometry_type='gltf')
Bases:
_ViewResultContainer with the results that should be visualized in a GeometryView. This consists of three-dimensional geometry object(s) and optional text labels.
To enable a geometric object for interaction, the object must be named using the ‘identifier’ argument. In case of a glTF/GLB-file, the objects name can be provided on the “name” key within a node. If none of the objects in the GeometryResult have a name assigned, default names are assigned to all of them (enabling them for interaction). Note: if there are multiple objects with the same name, a number will automatically be appended to enforce uniqueness.
Example viktor.geometry TransformableObject(s):
geometry = vkt.Sphere(Point(0, 0), 10, identifier="MySphere")
vkt.GeometryResult(geometry)  # or [obj1, obj2, ...] in case of multiple objects
By specifying the geometry_type you can render 3D geometry files either by providing a path, URL, or dynamically created (e.g. using trimesh). Currently supported geometry types are: “gltf”, “3dm”.
Example static geometry file from path:
geometry = vkt.File.from_path(Path(__file__).parent / "my_model.gltf")
vkt.GeometryResult(geometry, geometry_type="gltf")
Example static geometry file from a URL:
geometry = vkt.File.from_url("https://github.com/KhronosGroup/glTF-Sample-Models/tree/main/2.0/CesiumMilkTruck/glTF-Binary/CesiumMilkTruck.glb")
vkt.GeometryResult(geometry, geometry_type="gltf")
Example from FileField:
vkt.GeometryResult(params.my_geometry_file, geometry_type="gltf")Example dynamic geometry file (e.g. using trimesh):
sphere = trimesh.creation.uv_sphere(10) scene = trimesh.Scene(geometry={'sphere': sphere}) geometry = vkt.File() with geometry.open_binary() as w: w.write(trimesh.exchange.gltf.export_glb(scene)) vkt.GeometryResult(geometry, geometry_type="gltf")- Parameters:
geometry (
TransformableObject|Sequence[TransformableObject] |File|FileResource) – TransformableObject(s) that contain the geometric objects, or a geometry file such as glTF/GLB (v2.0) (https://en.wikipedia.org/wiki/GlTF).geometry_type (
str) – Type of loader that should be used to render the geometry (“gltf”, “3dm”)New in v14.4.0.labels (
List[Label]) – Text labels that can be used to provide additional information.
GeometryView
- class viktor.views.GeometryView(label, duration_guess=None, *, description=None, update_label=None, view_mode='3D', default_shadow=False, up_axis='Z', x_axis_to_right=None, visible=True)
Bases:
ViewFunction decorator to instruct the controller method to return a geometry view (2D / 3D).
Example usage:
@GeometryView("3D model")
def get_geometry_view(self, params, **kwargs):
    ...
    return GeometryResult(...)

@GeometryView("2D model", view_mode='2D')
def get_geometry_view_2d(self, params, **kwargs):
    ...
    return GeometryResult(...)
(new in v14.15.0) The ‘duration_guess’ argument is now optional.
See
GeometryResultfor example implementations.- Parameters:
label (
str) – SeeView.duration_guess (
int) – SeeView.description (
str) – SeeView.update_label (
str) – SeeView.view_mode (
Literal['2D','3D']) –Sets the view mode:
’3D’: Camera is free to move and user can choose between orthographic and perspective view.
’2D’: Camera is fixed on the xy-plane and view is orthographic.
default_shadow (
bool) – Show shadow when editor is opened. User can still switch it off.up_axis (
Literal['Y','Z']) – (view_mode=’3D’ only) Upwards pointing axis. Possible options: ‘Y’, ‘Z’ (default: ‘Z’)x_axis_to_right (
bool) – (view_mode=’3D’ and up_axis=’Y’ only) X-axis pointing to the right in the initial viewNew in v14.8.0visible (
bool|Callable) – Visibility of the view. Can depend on params by using a callback functionNew in v14.22.0
IFCAndDataResult
- class viktor.views.IFCAndDataResult(ifc, data)
Bases:
_ViewResultNew in v14.6.0Container with the results that should be visualized in an IFCAndDataView.
Please have a look at IFCResult for examples.
- Parameters:
ifc (
File|FileResource) – IFC geometry file.data (
DataGroup) – Result data.
IFCAndDataView
- class viktor.views.IFCAndDataView(label, duration_guess=None, *, description=None, update_label=None, visible=True, **kwargs)
Bases:
ViewNew in v14.6.0Function decorator to instruct the controller method to return a combined view consisting of an IFCView and a DataView.
Example usage:
@IFCAndDataView("IFC and data view")
def get_ifc_and_data_view(self, params, **kwargs):
    ifc = File.from_path(Path(__file__).parent / 'sample.ifc')
    data = ...
    return IFCAndDataResult(ifc, data)
(new in v14.15.0) The ‘duration_guess’ argument is now optional.
- Parameters:
label (
str) – Name which is shown on tab in interface. e.g: ‘3D Representation’duration_guess (
int) – Estimation of view calculation in seconds. This will be used to add a manual refresh button for long-running tasks (larger than 3s). This estimation does not need to be very precise, but the performance will be better if this is close to the real maximum computation time (defaults to 1).description (
str) – Show more information to the user through a tooltip on hover (max. 200 characters).update_label (
str) – Name which is shown on the update button in case of a slow view (max. 30 characters).visible (
bool|Callable) – Visibility of the view. Can depend on params by using a callback functionNew in v14.22.0
IFCResult
- class viktor.views.IFCResult(ifc)
Bases:
_ViewResultNew in v14.6.0IFC to be visualized in an IFCView.
Example static geometry file from path:
ifc = File.from_path(Path(__file__).parent / 'sample.ifc')
IFCResult(ifc)
Example static geometry file from a URL:
ifc = File.from_url("https://github.com/IFCjs/test-ifc-files/raw/main/Others/haus.ifc")
IFCResult(ifc)
(new in v14.6.1) In order to improve performance it is possible to use the value of a FileField (i.e. FileResource) directly:
IFCResult(params.file_field)- Parameters:
ifc (
File|FileResource) – IFC geometry file.
IFCView
- class viktor.views.IFCView(label, duration_guess=None, *, description=None, update_label=None, visible=True, **kwargs)
Bases:
ViewNew in v14.6.0Function decorator to instruct the controller method to return an IFCView.
Example usage:
@IFCView("IFC view")
def get_ifc_view(self, params, **kwargs):
    ifc = File.from_path(Path(__file__).parent / 'sample.ifc')
    return IFCResult(ifc)
(new in v14.15.0) The ‘duration_guess’ argument is now optional.
- Parameters:
label (
str) – Name which is shown on tab in interface. e.g: ‘3D Representation’duration_guess (
int) – Estimation of view calculation in seconds. This will be used to add a manual refresh button for long-running tasks (larger than 3s). This estimation does not need to be very precise, but the performance will be better if this is close to the real maximum computation time (defaults to 1).description (
str) – Show more information to the user through a tooltip on hover (max. 200 characters).update_label (
str) – Name which is shown on the update button in case of a slow view (max. 30 characters).visible (
bool|Callable) – Visibility of the view. Can depend on params by using a callback functionNew in v14.22.0
ImageAndDataResult
- class viktor.views.ImageAndDataResult(image, data)
Bases:
_ViewResultNew in v13.7.0Container with the image and result data that should be visualized in a ImageAndDataView.
Supported image types are ‘svg’, ‘jpeg’, ‘png’, ‘gif’.
ImageAndDataView
- class viktor.views.ImageAndDataView(label, duration_guess=None, *, description=None, update_label=None, visible=True, **kwargs)
Bases:
ViewNew in v13.7.0Function decorator to instruct the controller method to return a combined view consisting of an image and data.
Supported image types are ‘svg’, ‘jpeg’, ‘png’, ‘gif’.
Example usage:
@vkt.ImageAndDataView("Image View")
def get_image_data_view(self, params, **kwargs):
    ...
    return vkt.ImageAndDataResult(image, data_group)
(new in v14.15.0) The ‘duration_guess’ argument is now optional.
- Parameters:
label (
str) – Name which is shown on tab in interface. e.g: ‘3D Representation’duration_guess (
int) – Estimation of view calculation in seconds. This will be used to add a manual refresh button for long-running tasks (larger than 3s). This estimation does not need to be very precise, but the performance will be better if this is close to the real maximum computation time (defaults to 1).description (
str) – Show more information to the user through a tooltip on hover (max. 200 characters).update_label (
str) – Name which is shown on the update button in case of a slow view (max. 30 characters).visible (
bool|Callable) – Visibility of the view. Can depend on params by using a callback functionNew in v14.22.0
ImageResult
- class viktor.views.ImageResult(image)
Bases:
_ViewResultNew in v13.7.0Image to be visualized in an ImageView.
Supported image types are ‘svg’, ‘jpeg’, ‘png’, ‘gif’.
Example from FileField:
vkt.ImageResult(params.my_image_file)- Parameters:
image (
StringIO|BytesIO|File|FileResource) – image file.
- classmethod from_path(file_path)
Use file path to construct the image result.
- Parameters:
file_path (
str|bytes|PathLike) – Path to the image.- Return type:
ImageView
- class viktor.views.ImageView(label, duration_guess=None, *, description=None, update_label=None, visible=True, **kwargs)
Bases:
ViewNew in v13.7.0Function decorator to instruct the controller method to return an ImageView.
Supported image types are ‘svg’, ‘jpeg’, ‘png’, ‘gif’.
Example usage:
@vkt.ImageView("Image View")
def get_image_view(self, params, **kwargs):
    file_path = Path(__file__).parent / 'sample.png'
    return vkt.ImageResult(File.from_path(file_path))  # or `vkt.ImageResult.from_path(file_path)`
(new in v14.15.0) The ‘duration_guess’ argument is now optional.
- Parameters:
label (
str) – Name which is shown on tab in interface. e.g: ‘3D Representation’duration_guess (
int) – Estimation of view calculation in seconds. This will be used to add a manual refresh button for long-running tasks (larger than 3s). This estimation does not need to be very precise, but the performance will be better if this is close to the real maximum computation time (defaults to 1).description (
str) – Show more information to the user through a tooltip on hover (max. 200 characters).update_label (
str) – Name which is shown on the update button in case of a slow view (max. 30 characters).visible (
bool|Callable) – Visibility of the view. Can depend on params by using a callback functionNew in v14.22.0
InteractionEvent
- class viktor.views.InteractionEvent(event_type, value)
-
Event triggered by the user as a consequence of an
viktor.parametrization.Interaction.Warning
Do not instantiate this class directly, it is returned as ‘event’ in the method of the button with the corresponding interaction.
- Parameters:
event_type (
str) – type of the event (‘map_select’)value (
Any) –value of the user performed interaction. Type depends on event_type:
map_select: List[Union[str, int]] = identifier of selected features
Label
MapAndDataResult
- class viktor.views.MapAndDataResult(features, data, labels=None, legend=None, *, interaction_groups=None)
Bases:
GeoJSONAndDataResultContainer with the Map data and result data that should be visualized in a MapAndDataView. Optionally a legend and map labels can be included.
- Parameters:
features (
List[MapFeature]) – List that contains the map objects.data (
DataGroup) – Result data.labels (
List[MapLabel]) – Labels that should be placed on the map.legend (
MapLegend) – Map legend.interaction_groups (
Dict[str,Sequence[int|str|MapFeature]]) – create named groups that can be referred to in a map interactionNew in v13.2.0
- property features: List[MapFeature]
- property geojson: dict
MapAndDataView
- class viktor.views.MapAndDataView(label, duration_guess=None, *, description=None, update_label=None, visible=True, **kwargs)
Bases:
ViewFunction decorator to instruct the controller method to return a combined view consisting of a Map and data.
Example usage:
@vkt.MapAndDataView("Map / Data")
def get_map_data_view(self, params, **kwargs):
    ...
    return vkt.MapAndDataResult(...)
(new in v14.15.0) The ‘duration_guess’ argument is now optional.
- Parameters:
label (
str) – Name which is shown on tab in interface. e.g: ‘3D Representation’duration_guess (
int) – Estimation of view calculation in seconds. This will be used to add a manual refresh button for long-running tasks (larger than 3s). This estimation does not need to be very precise, but the performance will be better if this is close to the real maximum computation time (defaults to 1).description (
str) – Show more information to the user through a tooltip on hover (max. 200 characters).update_label (
str) – Name which is shown on the update button in case of a slow view (max. 30 characters).visible (
bool|Callable) – Visibility of the view. Can depend on params by using a callback functionNew in v14.22.0
MapCircle
- class viktor.views.MapCircle(center, radius, *, num_edges=64, fill_opacity=None, stroke_opacity=None, stroke_width=None, dash_size=None, gap_size=None, **kwargs)
Bases:
MapFeatureNew in v14.22.0Represents a circular polygon on the Earth’s surface formed by a latitude/longitude coordinate and radius [m].
Example usage:
circle = MapCircle( center=MapPoint(52.373922404495474, 5.2459716796875), radius=500 )- Parameters:
center (
MapPoint) – Center point of the circle.radius (
float) – Radius in [m].num_edges (
int) – Number of polygon edges.fill_opacity (
float) – opacity of the interior, between 0.0 and 1.0New in v14.30.0.stroke_opacity (
float) – opacity of the border, between 0.0 and 1.0New in v14.30.0.stroke_width (
float) – width of the border, greater than or equal to 0New in v14.30.0.dash_size (
float) – size of the dashes of a dashed border, relative to the width of the pathNew in v14.30.0.gap_size (
float) – size of the gaps of a dashed border, relative to the width of the pathNew in v14.30.0.kwargs (
Any) – SeeMapFeaturefor possible kwargs.
MapEntityLink
- class viktor.views.MapEntityLink(label, entity_id)
-
Represents a link between a feature in a MapView and a specific entity.
Example usage:
gef_link = MapEntityLink('GEF x', gef_entity_id) gef_marker = MapPoint(51.99311570849245, 4.385752379894256, entity_links=[gef_link])- Parameters:
label (
str) – text which is shown to the user.entity_id (
int) – id of the linked entity.
MapFeature
- class viktor.views.MapFeature(*, title=None, description=None, color=(39, 45, 51), entity_links=None, identifier=None)
Bases:
ABCBase class for features that can be shown in a MapView. See the documentation of the subclasses for example implementations.
- Parameters:
title (
str) – Title of a clickable map feature.description (
str) – Description of a clickable map feature.color (
Color) – Specifies the color of the map feature.entity_links (
List[MapEntityLink]) – When clicking on the map feature, links towards multiple entities can be shown.identifier (
int|str) – feature identifierNew in v13.2.0
MapLabel
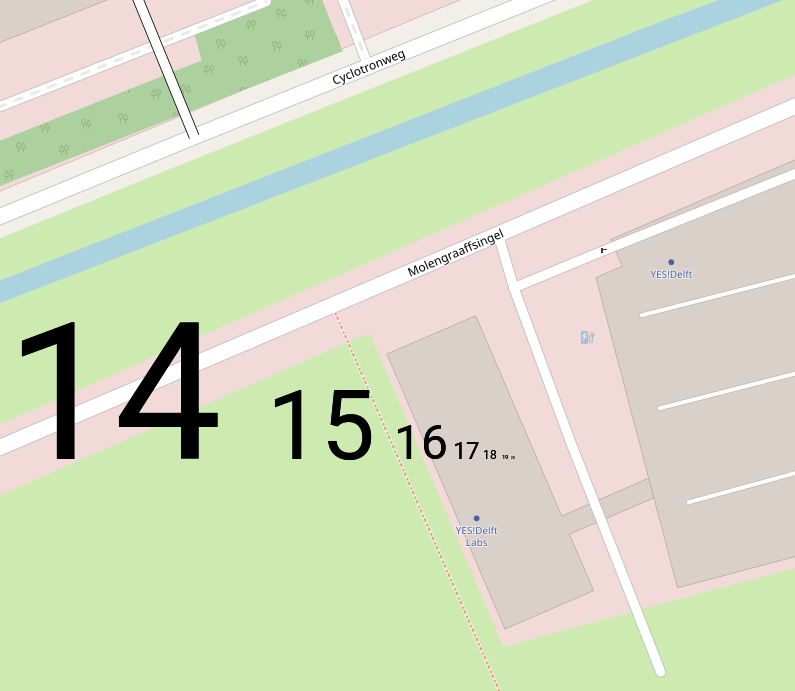
- class viktor.views.MapLabel(lat, lon, text, scale, *, fixed_size=False)
-
Text which is placed as an overlay on the map.
Scale 0-5 is approximately the scale for countries:
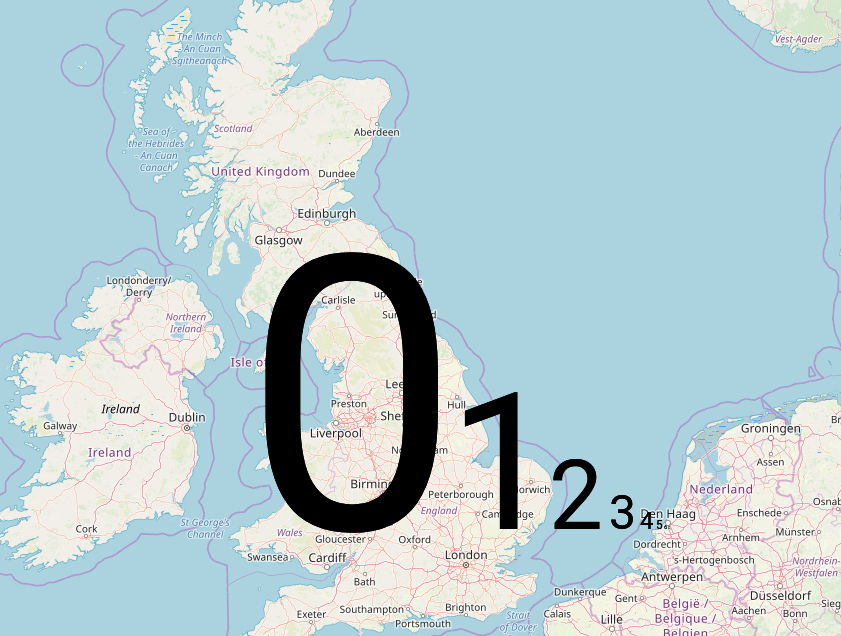
Scale 6-10 is approximately the scale for cities:
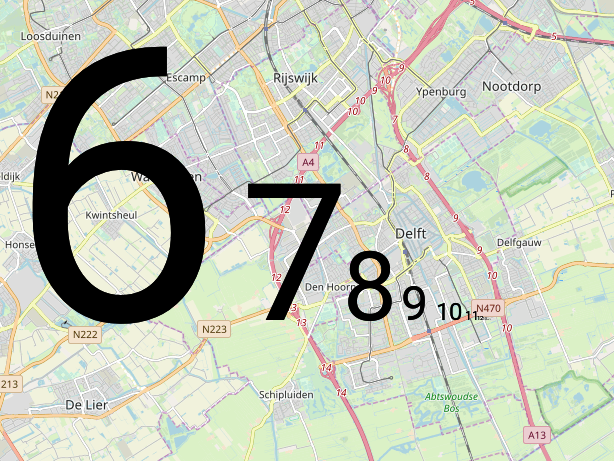
Scale 11-15 is approximately the scale for neighborhoods and streets
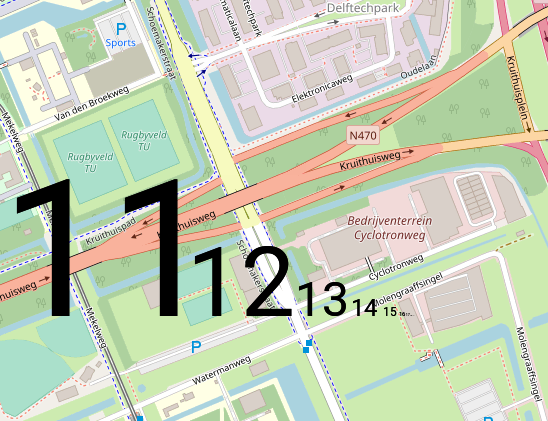
Scale 16-18 is approximately for individual houses.
- Parameters:
lat (
float) – Latitude of text in degrees.lon (
float) – Longitude of text in degrees.text (
str) – Text with is displayed on the map.scale (
float) – Size of the text on an exponential scale. See example in class docstring for estimate.fixed_size (
bool) – When True, the size of the text is fixed regardless of zoom level (default: False).
MapLegend
- class viktor.views.MapLegend(entries)
-
A legend which is placed as an overlay on a map view.
Example usage:
legend = MapLegend([ (Color.from_hex('#0016FF'), "I'm blue"), (Color.from_hex('#FF0000'), "I'm red"), ... ])- Parameters:
entries (
List[Tuple[Color,str]]) – Items in the legend, defined by color and label.
MapLine
- class viktor.views.MapLine(start_point, end_point, **kwargs)
Bases:
MapPolylineRepresents a line on the earth’s surface between two latitude/longitude pairs.
In case multiple line segments are to be created, a
MapPolylinemay be preferred.Example usage:
line = MapLine( MapPoint(51.99311570849245, 4.385752379894256), MapPoint(52.40912125231122, 5.031738281255681) )- Parameters:
start_point (
MapPoint) – Map point with latitude and longitude pair.end_point (
MapPoint) – Map point with latitude and longitude pair.kwargs (
Any) – SeeMapPolylineandMapFeaturefor possible kwargs.
MapPoint
- class viktor.views.MapPoint(lat, lon, alt=0, *, icon=None, size='medium', **kwargs)
Bases:
MapFeatureRepresents a point on the Earth’s surface described by a latitude/longitude coordinate pair.
Example usage:
marker = MapPoint(51.99311570849245, 4.385752379894256)- Parameters:
lat (
float) – Latitude.lon (
float) – Longitude.alt (
float) – Altitude.icon (
str) – icon to be shown (default: “pin”). See below for all possible icons.size (
Literal['small','medium','large']) – size of the marker (“small” | “medium” | “large”)New in v14.5.0.kwargs (
Any) – SeeMapFeaturefor possible kwargs.
List of icons:
arrow-down:

arrow-left:

arrow-right:

arrow-up:

chevron-down:

chevron-left:

chevron-right:

chevron-up:

circle:

circle-filled:

cross:

diamond:

diamond-horizontal:

drop:

exclamation-circle:

exclamation-circle-filled:

message:

minus:

minus-circle:

minus-circle-filled:

pin:

pin-add:

pin-edit:

plus:

plus-circle:

plus-circle-filled:

plus-thick:

question-circle:

question-circle-filled:

square:

square-filled:

star:

triangle:

triangle-down:

triangle-down-filled:

triangle-filled:

triangle-left:

triangle-left-filled:

triangle-right:

triangle-right-filled:

viktor:

warning:

warning-filled:

wye:

- property alt: float
- classmethod from_geo_point(point, *, icon=None, size='medium', **kwargs)
Instantiates a MapPoint from the provided GeoPoint.
- Parameters:
point (
GeoPoint) – GeoPoint.icon (
str) – icon to be shown (default: “pin”). For a complete list of all available markers, see__init__()size (
Literal['small','medium','large']) – size of the marker (“small” | “medium” | “large”)New in v14.5.0.kwargs (
Any) – SeeMapFeaturefor possible kwargs.
- Return type:
- property lat: float
- property lon: float
MapPolygon
- class viktor.views.MapPolygon(points, *, holes=None, fill_opacity=None, stroke_opacity=None, stroke_width=None, dash_size=None, gap_size=None, **kwargs)
Bases:
MapFeatureRepresents a polygon on the earth’s surface formed by a set of latitude/longitude pairs.
Example usage:
polygon = MapPolygon([ MapPoint(52.373922404495474, 5.2459716796875), MapPoint(52.10313118589299, 5.3997802734375), MapPoint(52.373922404495474, 5.57281494140625), ])- Parameters:
points (
List[MapPoint]) – Map points with latitude and longitude pair. The profile is automatically closed, so it is not necessary to add the start point at the end.holes (
List[MapPolygon]) – List of interior polygons which form holes in the exterior polygon.fill_opacity (
float) – opacity of the interior, between 0.0 and 1.0New in v14.30.0.stroke_opacity (
float) – opacity of the border, between 0.0 and 1.0New in v14.30.0.stroke_width (
float) – width of the border, greater than or equal to 0New in v14.30.0.dash_size (
float) – size of the dashes of a dashed border, relative to the width of the pathNew in v14.30.0.gap_size (
float) – size of the gaps of a dashed border, relative to the width of the pathNew in v14.30.0.kwargs (
Any) – SeeMapFeaturefor possible kwargs.
- classmethod from_geo_polygon(polygon, **kwargs)
Instantiates a MapPolygon from the provided GeoPolygon.
- Parameters:
polygon (
GeoPolygon) – GeoPolygon.kwargs (
Any) – SeeMapFeaturefor possible kwargs.
- Return type:
- property holes: List[MapPolygon]
MapPolyline
- class viktor.views.MapPolyline(*points, stroke_opacity=None, stroke_width=None, dash_size=None, gap_size=None, **kwargs)
Bases:
MapFeatureRepresents a polyline on the earth’s surface between several latitude/longitude pairs.
Example usage:
line = MapPolyline( MapPoint(51.99311570849245, 4.385752379894256), MapPoint(52.40912125231122, 5.031738281255681), ... )- Parameters:
points (
MapPoint) – MapPoints with latitude and longitude pair.stroke_opacity (
float) – opacity of the line, between 0.0 and 1.0New in v14.30.0.stroke_width (
float) – width of the line, greater than or equal to 0New in v14.30.0.dash_size (
float) – size of the dashes of a dashed line, relative to the width of the pathNew in v14.30.0.gap_size (
float) – size of the gaps of a dashed line, relative to the width of the pathNew in v14.30.0.kwargs (
Any) – SeeMapFeaturefor possible kwargs.
- classmethod from_geo_polyline(polyline, **kwargs)
Instantiates a MapPolyline from the provided GeoPolyline.
- Parameters:
polyline (
GeoPolyline) – GeoPolyline.kwargs (
Any) – SeeMapFeaturefor possible kwargs.
- Return type:
MapResult
- class viktor.views.MapResult(features, labels=None, legend=None, *, interaction_groups=None)
Bases:
GeoJSONResultContainer with the Map data that should be visualized in a MapView. Optionally a legend and map labels can be included.
- Parameters:
features (
List[MapFeature]) – List that contains the map objects.labels (
List[MapLabel]) – Labels that should be placed on the map.legend (
MapLegend) – Map legend.interaction_groups (
Dict[str,Sequence[int|str|MapFeature]]) – create named groups that can be referred to in a map interactionNew in v13.2.0
- property features: List[MapFeature]
- property geojson: dict
MapView
- class viktor.views.MapView(label, duration_guess=None, *, description=None, update_label=None, visible=True, **kwargs)
Bases:
ViewFunction decorator to instruct the controller method to return a Map (geographic data) view.
Example usage:
@vkt.MapView("Map")
def get_map_view(self, params, **kwargs):
    ...
    return vkt.MapResult(...)
(new in v14.15.0) The ‘duration_guess’ argument is now optional.
- Parameters:
label (
str) – Name which is shown on tab in interface. e.g: ‘3D Representation’duration_guess (
int) – Estimation of view calculation in seconds. This will be used to add a manual refresh button for long-running tasks (larger than 3s). This estimation does not need to be very precise, but the performance will be better if this is close to the real maximum computation time (defaults to 1).description (
str) – Show more information to the user through a tooltip on hover (max. 200 characters).update_label (
str) – Name which is shown on the update button in case of a slow view (max. 30 characters).visible (
bool|Callable) – Visibility of the view. Can depend on params by using a callback functionNew in v14.22.0
PDFResult
- class viktor.views.PDFResult(*, file=None, url=None)
Bases:
_ViewResultPDF document to be visualized in a PDFView. Can be defined from a File object or from a URL (direct-sharing). If both file and url are defined, url takes precedence.
In case of URL: the hosting website must allow for direct accessing for the document to be shown. If this is forbidden (undefined CORS-headers), the document can alternatively be shown via the file argument with a File.from_url(…), in which it is downloaded first and viewed subsequently (indirect-sharing).
Example usages:
From URL (direct-sharing):
PDFResult(url="https://www...")From URL (indirect-sharing):
f = File.from_url("https://www...")
PDFResult(file=f)
From path:
file_path = Path(__file__).parent / 'sample.pdf'
PDFResult.from_path(file_path)  # or ...
PDFResult(File.from_path(file_path))
From FileField:
PDFResult(file=params.my_pdf_file)- Parameters:
file (
File|FileResource) – PDF document to viewurl (
str) – URL of PDF document to view. If accessing the PDF directly from the URL is not allowed by the host website (undefined CORS-headers), this will result in the document not showing up in the view (as an alternative one can use File.from_url).
PDFView
- class viktor.views.PDFView(label, duration_guess=None, *, description=None, update_label=None, visible=True, **kwargs)
Bases:
ViewFunction decorator to instruct the controller method to return a PDFView.
Example usage:
@PDFView("PDF View")
def get_pdf_view(self, params, **kwargs):
    file_path = Path(__file__).parent / 'sample.pdf'
    return PDFResult(File.from_path(file_path))  # or `PDFResult.from_path(file_path)`
(new in v14.15.0) The ‘duration_guess’ argument is now optional.
- Parameters:
label (
str) – Name which is shown on tab in interface. e.g: ‘3D Representation’duration_guess (
int) – Estimation of view calculation in seconds. This will be used to add a manual refresh button for long-running tasks (larger than 3s). This estimation does not need to be very precise, but the performance will be better if this is close to the real maximum computation time (defaults to 1).description (
str) – Show more information to the user through a tooltip on hover (max. 200 characters).update_label (
str) – Name which is shown on the update button in case of a slow view (max. 30 characters).visible (
bool|Callable) – Visibility of the view. Can depend on params by using a callback functionNew in v14.22.0
PlotlyAndDataResult
- class viktor.views.PlotlyAndDataResult(figure, data)
Bases:
_ViewResultPlotly figure to be visualized in a PlotlyAndDataView. The figure can be provided in json-string or dict format.
(new in v14.22.0) Support a plotly ‘Figure’ object.
Example usage:
@PlotlyAndDataView("Plotly and data view") def get_plotly_and_data_view(self, params, **kwargs): data_group = ... fig = go.Figure( data=[go.Bar(x=[1, 2, 3], y=[1, 3, 2])], layout=go.Layout(title=go.layout.Title(text="A Figure Specified By A Graph Object")) ) return PlotlyAndDataResult(fig, data_group)- Parameters:
figure (
str|dict|Figure) – Plotly figuredata (
DataGroup) – result data
PlotlyAndDataView
- class viktor.views.PlotlyAndDataView(label, duration_guess=None, *, description=None, update_label=None, visible=True, **kwargs)
Bases:
ViewFunction decorator to instruct the controller method to return a combined view consisting of a PlotlyView and a DataView.
Example usage:
@PlotlyAndDataView("Plotly and data view")
def get_plotly_and_data_view(self, params, **kwargs):
    ...
    return PlotlyAndDataResult(figure, data_group)
(new in v14.15.0) The ‘duration_guess’ argument is now optional.
- Parameters:
label (
str) – Name which is shown on tab in interface. e.g: ‘3D Representation’duration_guess (
int) – Estimation of view calculation in seconds. This will be used to add a manual refresh button for long-running tasks (larger than 3s). This estimation does not need to be very precise, but the performance will be better if this is close to the real maximum computation time (defaults to 1).description (
str) – Show more information to the user through a tooltip on hover (max. 200 characters).update_label (
str) – Name which is shown on the update button in case of a slow view (max. 30 characters).visible (
bool|Callable) – Visibility of the view. Can depend on params by using a callback functionNew in v14.22.0
PlotlyResult
- class viktor.views.PlotlyResult(figure)
Bases:
_ViewResultPlotly figure to be visualized in a PlotlyView. The figure can be provided in json-string or dict format.
(new in v14.22.0) Support a plotly ‘Figure’ object.
Example usages:
@PlotlyView("Plotly view") def get_plotly_view(self, params, **kwargs): fig = go.Figure( data=[go.Bar(x=[1, 2, 3], y=[1, 3, 2])], layout=go.Layout(title=go.layout.Title(text="A Figure Specified By A Graph Object")) ) return PlotlyResult(fig)@PlotlyView("Plotly view") def get_plotly_view(self, params, **kwargs): fig = { "data": [{"type": "bar", "x": [1, 2, 3], "y": [1, 3, 2]}], "layout": {"title": {"text": "A Figure Specified By Python Dictionary"}} } return PlotlyResult(fig)- Parameters:
figure (
str|dict|Figure) – Plotly figure
PlotlyView
- class viktor.views.PlotlyView(label, duration_guess=None, *, description=None, update_label=None, visible=True, **kwargs)
Bases:
ViewFunction decorator to instruct the controller method to return a PlotlyView.
Example usage:
@PlotlyView("Plotly view")
def get_plotly_view(self, params, **kwargs):
    ...
    return PlotlyResult(figure)
(new in v14.15.0) The ‘duration_guess’ argument is now optional.
- Parameters:
label (
str) – Name which is shown on tab in interface. e.g: ‘3D Representation’duration_guess (
int) – Estimation of view calculation in seconds. This will be used to add a manual refresh button for long-running tasks (larger than 3s). This estimation does not need to be very precise, but the performance will be better if this is close to the real maximum computation time (defaults to 1).description (
str) – Show more information to the user through a tooltip on hover (max. 200 characters).update_label (
str) – Name which is shown on the update button in case of a slow view (max. 30 characters).visible (
bool|Callable) – Visibility of the view. Can depend on params by using a callback functionNew in v14.22.0
Summary
- class viktor.views.Summary(**items)
Bases:
OrderedDictSummary of resulting data items, which can be used in the summary view of an entity.
Example usage:
class Controller: ... summary = Summary( item_1=SummaryItem(...), item_2=SummaryItem(...), item_3=SummaryItem(...) )- Parameters:
items (
SummaryItem) – Items that are shown in the summary, with a maximum of 6 items per summary.
SummaryItem
- class viktor.views.SummaryItem(label, item_type, source, value_path, *, suffix='', prefix='')
-
A summary consists of SummaryItem objects, that define which input / result values should be displayed.
Suppose we have a data view with a controller method ‘data_view’, which returns a DataItem with key ‘output_item_1’. The following summary item can be constructed to refer to this result:
item_1 = SummaryItem('Label', float, 'data_view', 'output_item_1', suffix='N')Suppose we have a parametrization with a certain parameter defined as geometry.input.length, this can be converted to a summary item by doing:
item_2 = SummaryItem('Length', float, 'parametrization', 'geometry.input.length', suffix='m')- Parameters:
label (
str) – Text label of the item.item_type (
Type[str|float]) – Type of value, options are ‘str’ | ‘float’.source (
str) – Source from which the input / output should be extracted.value_path (
str) – Dotted path of value in parametrization / data structure of view. e.g: level1.level2.valuesuffix (
str) – A suffix will be put behind the value to provide additional information such as units.prefix (
str) – A prefix will be put in front of the value to provide info such as a dollar sign.
TableCell
- class viktor.views.TableCell(value, *, text_color=None, background_color=None, text_style=None)
TableHeader
- class viktor.views.TableHeader(title, *, align=None, num_decimals=None)
-
Header object that can be used in
TableResultto set styling.- Parameters:
title (
str) – Title that will be shown in the header.align (
Literal['center','left','right'] |None) – Visual alignment of the corresponding row/column values within the tablenum_decimals (
int|None) – Number of decimals that is shown for the row/column values (requires corresponding row/column to contain only numbers).
TableResult
- class viktor.views.TableResult(data, *, column_headers=None, row_headers=None, enable_sorting_and_filtering=None)
Bases:
_ViewResultNew in v14.13.0Data to be visualized in an TableView.
Example of a simple TableResult:
data = [
    [1.5, "Square"],
    [3.1, "Circle"],
]
TableResult(data)
Example of a simple TableResult with column header titles:
data = [
    [1.5, "Square"],
    [3.1, "Circle"],
]
TableResult(data, column_headers=["Area [m²]", "Shape"])
Example of a more complex TableResult with column and cell styling:
data = [
    [1.5, "Square"],
    [
        TableCell(3.1, text_color=Color.green()),
        TableCell("Circle", background_color=Color(211, 211, 211), text_style='italic')
    ],
]
TableResult(data, column_headers=[
    TableHeader("Area [m²]", num_decimals=2),
    TableHeader("Shape", align='center')
]))
Example of a transposed table:
data = [
    [1.5, "Square"],
    [3.1, "Circle"],
]
transposed_data = [list(i) for i in zip(*data)]
TableResult(
    transposed_data,
    row_headers=[
        TableHeader("Area [m²]", num_decimals=2),
        TableHeader("Shape", align='center')
    ],
    column_headers=["Object 1", "Object 2"]
))
Example of a pandas Dataframe object:
df = pd.DataFrame([[1, 4], [2, 3]])
TableResult(df)
Example of a pandas Styler object:
df = pd.DataFrame([[1, 4], [2, 3]])
styler = df.style.highlight_min(color="red")
TableResult(styler)
Result to be shown in a TableView.
In case the data is a pandas Styler object, the following properties will be inherited:
background_color (per cell)
text_color (per cell)
text_style (per cell, bold or italic)
align (per column/row, only if all cells in a row/column have the same alignment)
- Parameters:
data (
Sequence[Sequence[str|float|int|bool|datetime|date|None|TableCell]] |DataFrame|Styler) – Table content. Can also be a pandas DataFrame or Styler object.column_headers (
Sequence[str|TableHeader] |None) – Headers shown above the columns. Can be used for custom titles and styling. In case the data is a pandas Styler object, this can be set explicitly to overwrite the generated titles and styling.row_headers (
Sequence[str|TableHeader] |None) – Headers shown next to the rows. Can be used for custom titles and styling. In case the data is a pandas Styler object, this can be set explicitly to overwrite the generated titles and styling.enable_sorting_and_filtering (
bool|None) – Enable sorting and filtering on columns. If set to None (default), sorting and filtering will be enabled if each of the columns in data is of homogeneous type, and disabled otherwise. If sorting and filtering is enabled explicitly, each column must be of homogeneous type.
TableView
- class viktor.views.TableView(label, duration_guess=None, *, description=None, update_label=None, visible=True, **kwargs)
Bases:
ViewNew in v14.13.0Function decorator to instruct the controller method to return an TableView.
Example usage:
@TableView("Table view")
def get_table_view(self, params, **kwargs):
    data = [
        [2.5, 7, "Square"],
        [1.5, 8, "Circle"],
    ]
    return TableResult(data, column_headers=["Width", "Height", "Shape"])
(new in v14.15.0) The ‘duration_guess’ argument is now optional.
- Parameters:
label (
str) – Name which is shown on tab in interface. e.g: ‘3D Representation’duration_guess (
int) – Estimation of view calculation in seconds. This will be used to add a manual refresh button for long-running tasks (larger than 3s). This estimation does not need to be very precise, but the performance will be better if this is close to the real maximum computation time (defaults to 1).description (
str) – Show more information to the user through a tooltip on hover (max. 200 characters).update_label (
str) – Name which is shown on the update button in case of a slow view (max. 30 characters).visible (
bool|Callable) – Visibility of the view. Can depend on params by using a callback functionNew in v14.22.0
View
- class viktor.views.View(label, duration_guess=None, *, description=None, update_label=None, visible=True, **kwargs)
Bases:
ABCWarning
Do not use this class directly in an application.
Base-class of a function decorator that can be used to specify the desired view to be returned. See the subclasses for specific examples of each type of view.
(new in v14.15.0) The ‘duration_guess’ argument is now optional.
- Parameters:
label (
str) – Name which is shown on tab in interface. e.g: ‘3D Representation’duration_guess (
int) – Estimation of view calculation in seconds. This will be used to add a manual refresh button for long-running tasks (larger than 3s). This estimation does not need to be very precise, but the performance will be better if this is close to the real maximum computation time (defaults to 1).description (
str) – Show more information to the user through a tooltip on hover (max. 200 characters).update_label (
str) – Name which is shown on the update button in case of a slow view (max. 30 characters).visible (
bool|Callable) – Visibility of the view. Can depend on params by using a callback functionNew in v14.22.0
WebAndDataResult
- class viktor.views.WebAndDataResult(*, html=None, url=None, data=None)
Bases:
_ViewResultContainer with the web data and result data that should be visualized in a WebAndDataView.
The Web part can be constructed in two ways, which should not be used together:
url: to serve a URL (takes precedence if both are defined)
html: for serving a single html page
WebAndDataView
- class viktor.views.WebAndDataView(label, duration_guess=None, *, description=None, update_label=None, visible=True, **kwargs)
Bases:
ViewFunction decorator to instruct the controller method to return a combined view consisting of web-content and data.
Example usage:
@WebAndDataView("Web / Data")
def get_web_data_view(self, params, **kwargs):
    # calculate data
    ...
    return WebAndDataResult(html="<html>Hello world</html>", data=data_group)
(new in v14.15.0) The ‘duration_guess’ argument is now optional.
- Parameters:
label (
str) – Name which is shown on tab in interface. e.g: ‘3D Representation’duration_guess (
int) – Estimation of view calculation in seconds. This will be used to add a manual refresh button for long-running tasks (larger than 3s). This estimation does not need to be very precise, but the performance will be better if this is close to the real maximum computation time (defaults to 1).description (
str) – Show more information to the user through a tooltip on hover (max. 200 characters).update_label (
str) – Name which is shown on the update button in case of a slow view (max. 30 characters).visible (
bool|Callable) – Visibility of the view. Can depend on params by using a callback functionNew in v14.22.0
WebResult
- class viktor.views.WebResult(*, html=None, url=None)
Bases:
_ViewResultContainer with the data that should be visualized in a WebView. There are two options, which should not be used together:
url: to serve a URL (takes precedence if both are defined)
html: for serving a single html page
Example usage:
@vkt.WebView("Hello world") def get_web_view(self, params, **kwargs): html = textwrap.dedent(""" <html> <head> <meta charset="UTF-8"> <title>My View</title> </head> <body> <h1>Hello world 🌎</h1> </body> </html> """) return vkt.WebResult(html=html)@vkt.WebView('Python wiki') def get_web_view(self, params, **kwargs): return vkt.WebResult(url='https://en.wikipedia.org/wiki/Python_(programming_language)')- Parameters:
html (
StringIO|File|str) – HTML formatted content.url (
str) – Direct URL.
WebView
- class viktor.views.WebView(label, duration_guess=None, *, description=None, update_label=None, visible=True, **kwargs)
Bases:
ViewFunction decorator to instruct the controller method to return a web-content view.
Example usage:
@vkt.WebView("Hello world")
def get_web_view(self, params, **kwargs):
    return vkt.WebResult(html="<html>Hello world</html>")
(new in v14.15.0) The ‘duration_guess’ argument is now optional.
- Parameters:
label (
str) – Name which is shown on tab in interface. e.g: ‘3D Representation’duration_guess (
int) – Estimation of view calculation in seconds. This will be used to add a manual refresh button for long-running tasks (larger than 3s). This estimation does not need to be very precise, but the performance will be better if this is close to the real maximum computation time (defaults to 1).description (
str) – Show more information to the user through a tooltip on hover (max. 200 characters).update_label (
str) – Name which is shown on the update button in case of a slow view (max. 30 characters).visible (
bool|Callable) – Visibility of the view. Can depend on params by using a callback functionNew in v14.22.0