Show plots, charts & graphs
Using Plotly
Plotly is a free and open source package that simplifies the creation of
interactive graphs, such as line plots, scatter plots, histograms, etc. A Plotly graph can be incorporated in your
VIKTOR app by making use of a PlotlyView.
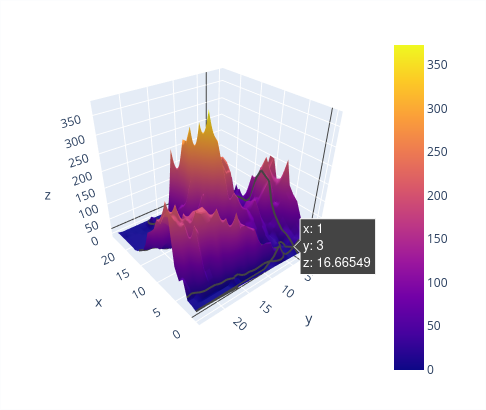 Example of how an interactive visualization in the PlotlyView could look like (source: plot.ly)
The Plotly graph can either be passed to a PlotlyResult as a
go.Figure object, or as a valid Plotly dict:
import viktor as vkt
import plotly.graph_objects as go


class Controller(vkt.Controller):

    @vkt.PlotlyView("Plotly view")
    def get_plotly_view(self, params, **kwargs):
        fig = go.Figure(
            data=[go.Bar(x=[1, 2, 3], y=[1, 3, 2])],
            layout=go.Layout(title=go.layout.Title(text="A Figure Specified By A Graph Object"))
        )
        return vkt.PlotlyResult(fig)
import viktor as vkt


class Controller(vkt.Controller):

    @vkt.PlotlyView("Plotly view")
    def get_plotly_view(self, params, **kwargs):
        fig = {
            "data": [{"type": "bar", "x": [1, 2, 3], "y": [1, 3, 2]}],
            "layout": {"title": {"text": "A Figure Specified By Python Dictionary"}}
        }
        return vkt.PlotlyResult(fig)
A Plotly view can be combined with data using a PlotlyAndDataView
Testing
mock_View decorator for easier testing of view methods
Methods decorated with @PlotlyView or @PlotlyAndDataView need to be
mocked within the context of (automated) testing.
import unittest

from viktor.testing import mock_View

from app.my_entity_type.controller import MyEntityTypeController

class TestMyEntityTypeController(unittest.TestCase):

    @mock_View(MyEntityTypeController)
    def test_plotly_view(self):
        params = ...
        result = MyEntityTypeController().plotly_view(params=params)
        self.assertEqual(result.figure, ...)
Using Matplotlib
You can show Matplotlib figures as static images using ImageView.
If you want an interactive graph and have a more sophisticated data visualisation tool, we recommend using Plotly.
Here is an example of how to use Matplotlib:
import viktor as vkt
import numpy as np
import matplotlib.pyplot as plt
from io import StringIO


class Parametrization(vkt.Parametrization):
    introduction = vkt.Text("Fill in values for A, B and C to plot the following equation: $y = Ax^2 + Bx + C$")
    constant_a = vkt.NumberField('A',default=1)
    constant_b = vkt.NumberField('B', default=1)
    constant_c = vkt.NumberField('C', default=1)


class Controller(vkt.Controller):
    parametrization = Parametrization

    @vkt.ImageView("Plot")
    def createPlot(self, params, **kwargs):
        fig = plt.figure()
        x = np.arange(-10, 10, 1)
        y = params.constant_a*x**2 + params.constant_b*x + params.constant_c
        plt.plot(x, y)

        svg_data = StringIO()
        fig.savefig(svg_data, format='svg')
        plt.close()

        return vkt.ImageResult(svg_data)