Show data & tables
There are two different ways to present data in a view:
- For a table-like presentation of data, you can use the TableView
- For a tree-like presentation of grouped data (flat or nested), you can use the DataView
TableView
The TableView is a trade-off between simplicity and flexibility. If you need more control on styling,
this package might suit your needs. It uses a WebView under
the hood.
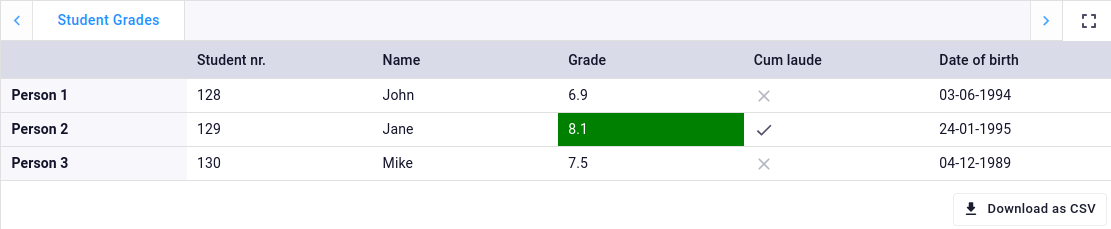
The TableView provides means to present data in a tabular form. The view has a button
to download the data as CSV.
 Example TableView
A table view can be created by passing data to a TableResult in a view-method
decorated with @TableView:
from datetime import date

import viktor as vkt


class Controller(vkt.Controller):

    @vkt.TableView("Student Grades")
    def table_view(self, params, **kwargs):
        data = [
            [128, "John", 6.9, False, date(1994, 6, 3)],
            [129, "Jane", 8.1, True, date(1995, 1, 24)],
            [130, "Mike", 7.5, False, date(1989, 12, 4)],
        ]

        return vkt.TableResult(data)
Custom headers
Custom headers can be set on both rows and columns by passing respectively row_headers and column_headers in the
TableResult:
    @vkt.TableView("Student Grades")
    def table_view(self, params, **kwargs):
        ...

        return vkt.TableResult(
            data,
            row_headers=["Person 1", "Person 2", "Person 3"],
            column_headers=["Student nr.", "Name", "Grade", "Cum laude", "Date of birth"]
        )
If no headers are provided, the default headers (1, 2, 3, ...) will be shown.
Sorting & filtering
Sorting & filtering is automatically enabled on the columns if each of the columns contains data of homogeneous type.
You can disable sorting & filtering by setting enable_sorting_and_filtering=False on the TableResult:
return vkt.TableResult(..., enable_sorting_and_filtering=False)
Styling
Styling on a per-cell basis can be applied by replacing the value in data with a
TableCell instance. The following styling can be applied on a per-cell basis:
text_color: color of the text. Can be anyColorbackground_color: color of the cell background. Can be anyColortext_style: style of the text. Can be one of: 'bold', 'italic'
import viktor as vkt


class Controller(vkt.Controller):

    @vkt.TableView("Table")
    def table_view(self, params, **kwargs):
        data = [
            [1, 2, 1],
            [2, TableCell(3, background_color=vkt.Color.green()), 2],
            [1, 2, 1],
        ]

        return vkt.TableResult(data)
Styling on a per-column/row basis can be applied by setting a TableHeader on
respectively column_headers or row_headers within TableResult. The following styling can be applied on a
per-column/row basis:
num_decimals: number of decimals to which the value is rounded (numbers only)align: alignment of the text within the column/row. Can be one of: 'left', 'center', 'right'
import viktor as vkt


class Controller(vkt.Controller):

    @vkt.TableView("Student Grades")
    def table_view(self, params, **kwargs):
        data = [
            ["John", 6.9],
            ["Jane", 8.1],
            ["Mike", 7.5],
        ]

        return vkt.TableResult(data, column_headers=[
            "Name",
            vkt.TableHeader("Grade", num_decimals=0)
        ])
Transposing the data
Sometimes it is preferred to present data in a transposed table (with homogeneous types on rows instead of columns),
for example when the number of columns would otherwise be much larger than the number of rows. This can simply be
achieved by transposing the data yourself, and exchanging row_headers and column_headers in the TableResult, as
shown in the following example:
Sorting & filtering is disabled if one or more columns contain mixed-type data.
from datetime import date

import viktor as vkt


class Controller(vkt.Controller):

    @vkt.TableView("Student Grades")
    def table_view(self, params, **kwargs):
        data = [
            [128, "John", 6.9, False, date(1994, 6, 3)],
            [129, "Jane", vkt.TableCell(8.1, background_color=vkt.Color.green()), True, date(1995, 1, 24)],
            [130, "Mike", 7.5, False, date(1989, 12, 4)],
        ]

        transposed_data = [list(d) for d in zip(*data)]

        return vkt.TableResult(
            transposed_data,
            row_headers=["Student nr.", "Name", "Grade", "Cum laude", "Date of birth"],
            column_headers=["Person 1", "Person 2", "Person 3"],
        )
![]() Example of transposed table
Example of transposed table
Using pandas
It is possible to pass a pandas DataFrame or Styler object directly into a
TableResult. The column and index names of the DataFrame will be taken as columns_headers and row_headers
respectively:
Setting explicit columns_headers and row_headers in TableResult will override the column and index names of the
pandas DataFrame.
from datetime import date
import pandas as pd
import viktor as vkt


class Controller(vkt.Controller):

    @vkt.TableView("Table")
    def table_view(self, params, **kwargs):
        df = pd.DataFrame(
            data=[
                [128, "John", 6.9, False, date(1994, 6, 3)],
                [129, "Jane", 8.1, True, date(1995, 1, 24)],
                [130, "Mike", 7.5, False, date(1989, 12, 4)],
            ],
            columns=["Student nr.", "Name", "Grade", "Cum laude", "Date of birth"],
            index=["Person 1", "Person 2", "Person 3"],
        )

        return vkt.TableResult(df)
The following styling properties of a pandas Styler object are supported:
- Background color (per cell)
- Text color (per cell)
- Text style (per cell, bold or italic)
- Align (per column/row, only if all cells in a row/column have the same alignment)
To make use of pandas styling, you need to add the pandas[output-formatting] package to your requirements.txt
from datetime import date
import pandas as pd
import viktor as vkt


class Controller(vkt.Controller):

    @vkt.TableView("Table")
    def table_view(self, params, **kwargs):
        df = pd.DataFrame(
            data=[
                [128, "John", 6.9, False, date(1994, 6, 3)],
                [129, "Jane", 8.1, True, date(1995, 1, 24)],
                [130, "Mike", 7.5, False, date(1989, 12, 4)],
            ],
            columns=["Student nr.", "Name", "Grade", "Cum laude", "Date of birth"],
            index=["Person 1", "Person 2", "Person 3"],
        )

        df = df.transpose()
        styler = df.style.highlight_max(color="green", axis='columns', subset=pd.IndexSlice[['Grade'], :])

        return vkt.TableResult(styler)
DataView
With a DataView, results can be grouped and be presented in a tree-like form. The data
can be flat, or nested up to a maximum of 3 levels.
 Example DataView
The following steps have to be performed to visualize the desired results:
- Create the data group(s) consisting of
DataItems for visualization. - Pass the group(s) to a decorated view method that returns a
DataResult.
import viktor as vkt


class Controller(vkt.Controller):

    @vkt.DataView("Results")
    def visualize_data(self, params, **kwargs):
        data = vkt.DataGroup(
            vkt.DataItem('Data item 1', 123)
        )
        return vkt.DataResult(data)
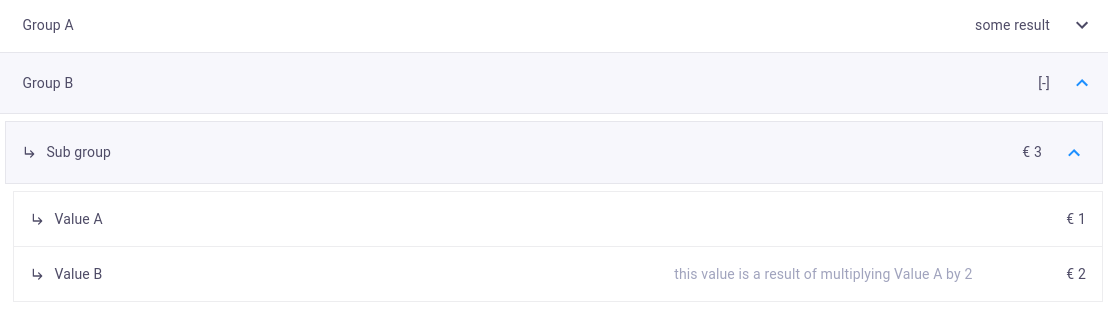
Multilayered DataGroup
Below an example is given of a multilayered output group (maximum of three layers deep):
import viktor as vkt


class Controller(vkt.Controller):

    @vkt.DataView("Results")
    def visualize_data(self, params, **kwargs):
        value_a = 1
        value_b = 2 * value_a
        value_total = value_a + value_b
        data = vkt.DataGroup(
            group_a=vkt.DataItem('Group A', 'some result', subgroup=vkt.DataGroup(
                sub_group=vkt.DataItem('Result', 1, suffix='N')
            )),
            group_b=vkt.DataItem('Group B', '', subgroup=vkt.DataGroup(
                sub_group=vkt.DataItem('Sub group', value_total, prefix='€', subgroup=vkt.DataGroup(
                    value_a=vkt.DataItem('Value A', value_a, prefix='€'),
                    value_b=vkt.DataItem('Value B', value_b, prefix='€', explanation_label='this value is a result of multiplying Value A by 2')
                ))
            ))
        )

        return vkt.DataResult(data)
The explanation_label can be used to inform the user. The output result will look like this:
 Example DataView
Positional or key-worded DataItem?
In previous examples, we saw a DataGroup created with and without the use of keyword arguments. Using keywords is
necessary to link the corresponding DataItem to the Summary. A detailed guide of the Summary can be found
here.
Dynamic group length
The structure of DataGroups allows for dynamic creation/addition of data to the overall result, as long as the
maximum number of items is not exceeded. An example of dynamically creating data items is shown below:
import viktor as vkt


class Controller(vkt.Controller):

    @vkt.DataView("Results")
    def visualize_data(self, params, **kwargs):
        dynamic_dict = {
            "item 1": 1,
            "item 2": 2,
            # etc.
        }

        # loop through items
        total_value = 0
        data_items = []
        for item, value in dynamic_dict.items():
            data_items.append(
                vkt.DataItem(item, value)
            )
            total_value += value

        # construct data group
        data = vkt.DataGroup(*data_items)
        return vkt.DataResult(data)
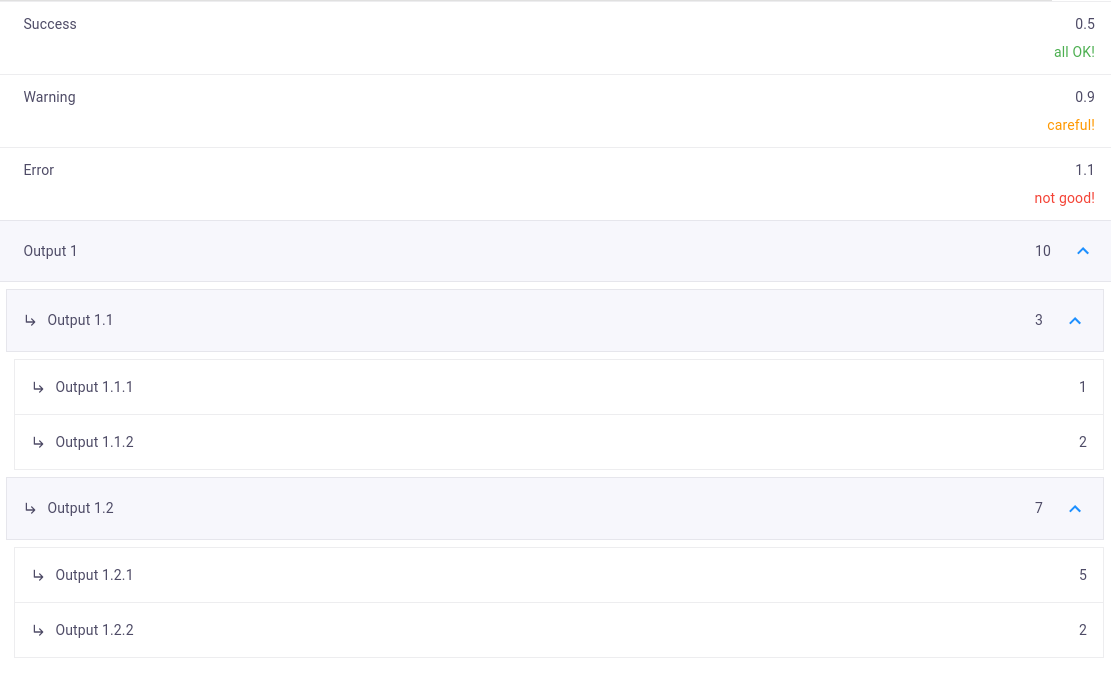
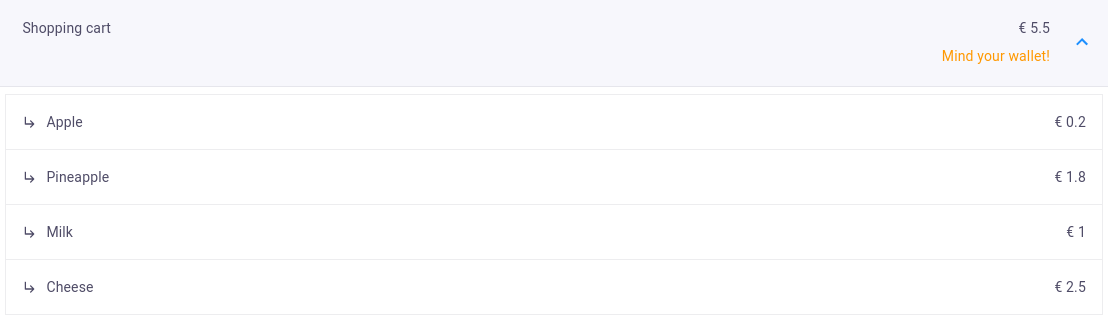
Setting warning/error statuses
Sometimes it is desired to warn a user when a result exceeds a certain values. For these cases, the status and
status_message arguments of a DataItem can be considered. Suppose we want to warn the user if our shopping cart of
the example above exceeds 5 euros, we can add the following:
import viktor as vkt


class Controller(vkt.Controller):

    @vkt.DataView("Results")
    def visualize_data(self, params, **kwargs):
        shopping_cart = {
            'Apple': 0.20,
            'Pineapple': 1.80,
            'Milk': 1,
            'Cheese': 2.50
        }

        # loop through products
        total_cost = 0
        data_items = []
        for item, price in shopping_cart.items():
            data_items.append(
                vkt.DataItem(item, price, prefix='€')
            )
            total_cost += price

        # construct data group
        if total_cost <= 5:
            status = vkt.DataStatus.SUCCESS
            status_msg = ''
        else:
            status = vkt.DataStatus.WARNING
            status_msg = 'Mind your wallet!'
        data = vkt.DataGroup(
            vkt.DataItem('Shopping cart', total_cost, prefix='€', status=status, status_message=status_msg, subgroup=vkt.DataGroup(*data_items))
        )
        return vkt.DataResult(data)
 Example status message
Testing
mock_View decorator for easier testing of view methods
Methods decorated with @TableView and @DataView need to be mocked within
the context of (automated) testing:
import unittest

from viktor.testing import mock_View

from app.my_entity_type.controller import MyEntityTypeController

class TestMyEntityTypeController(unittest.TestCase):

    @mock_View(MyEntityTypeController)
    def test_data_view(self):
        params = ...
        result = MyEntityTypeController().data_view(params=params)
        self.assertEqual(result.data, ...)