Interactive debugging
The goal of this page is to set up your code editor in such a way, that you will be able to start VIKTOR in debugging mode from your code editor, set breakpoints and inspect the values of variables in your code editor. Depending on your code editor, operating system and virtualization mode the instructions are different. We provide instructions for the following platforms, code editors and virtualization modes:
Operating system:
- Windows
- Linux
- Cloud-based development
Code editor:
- PyCharm
- VS Code
Virtualization mode:
- Venv
- Docker
Configure the code editor
Before configuring the code editor for debugging, make sure you have installed your application by using viktor-cli install.
The steps for configuring your editor depend on your operating system, VIKTOR isolation mode and editor. Below instructions assume the app resides in a folder called 'my-app-folder'.
First, select your code editor and operating system:
- Windows
- Linux
- Cloud-based development
- PyCharm
- VS Code
- Virtual environment
- Docker (Hyper-V)
- Docker (WSL)
Configure the Python interpreter
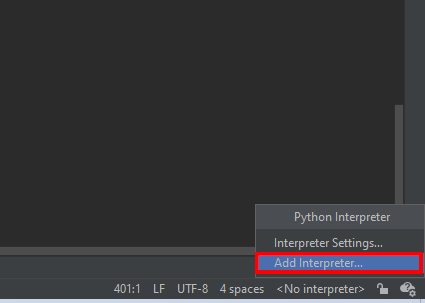
In the bottom right, add a Python interpreter by clicking the Python 3.X (or <no interpreter>) button, followed by add interpreter.
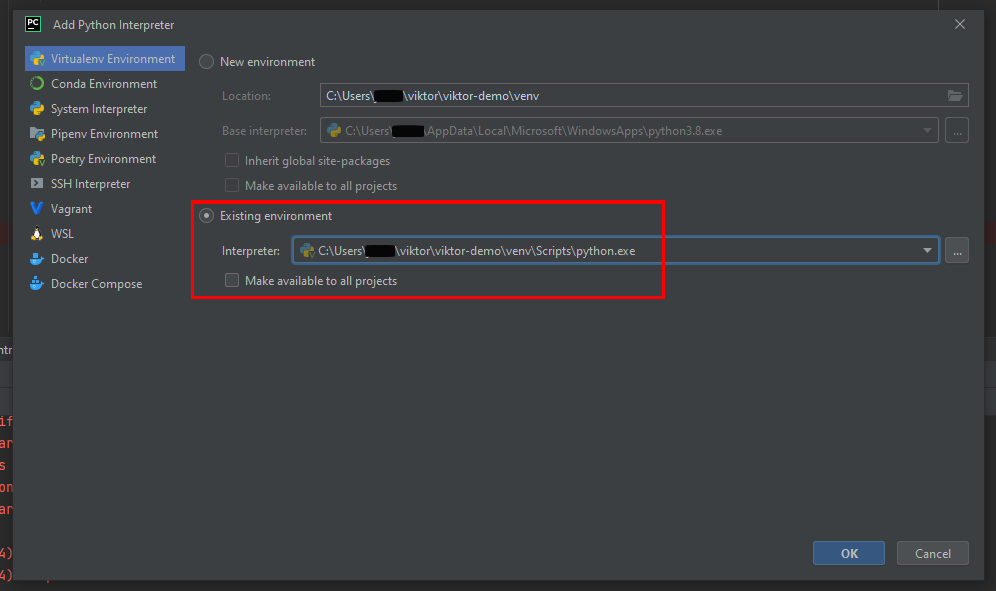
Then select "existing environment", usually this is selected automatically. Then select the Python interpreter <project-name>\venv\Scripts\python.exe folder if it is not already selected. Click "ok" to save the settings.
Set up debugging
Next, in the top menu, click Run > Edit configurations.
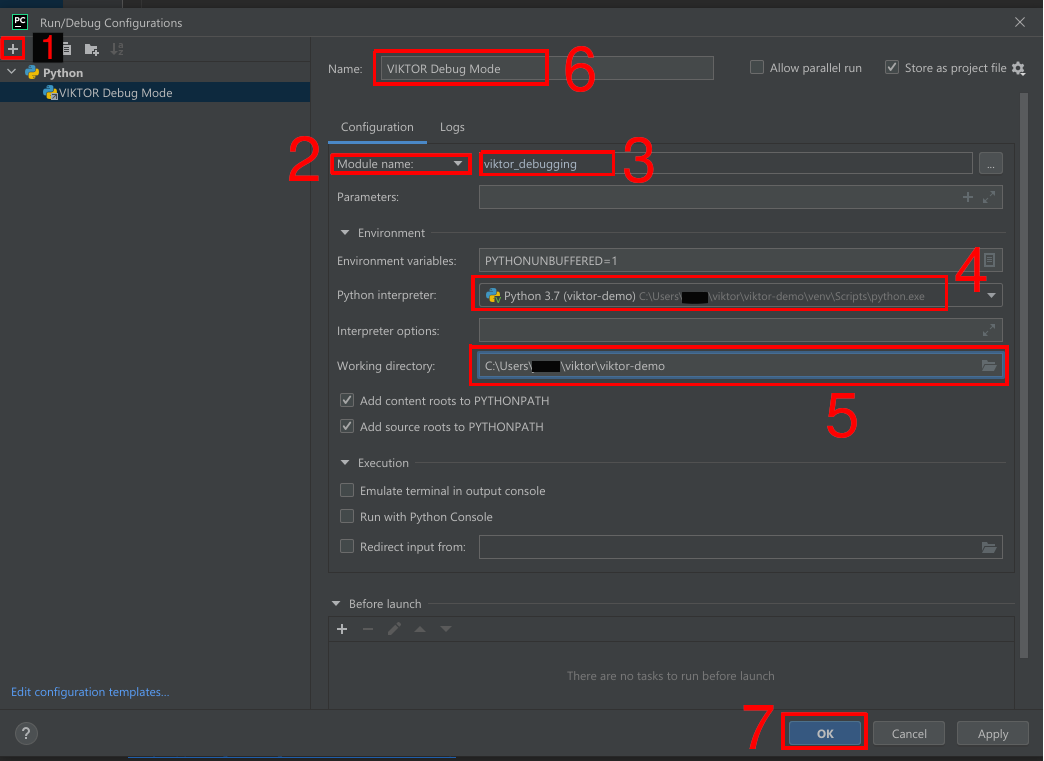
A modal will appear where you can create new debug configurations. Then follow these steps:
- Click the
+in the top-left and from the dropdown selectPythonto create a new debug configuration - Change
Script pathtoModule name - Type
viktor_debuggingin the field for the module name - Select the Python interpreter you just configured
- Change the working directory to the project directory.
- (optionally) give the configuration a name, such as "VIKTOR Debug"
- Click
OKto save the debug configuration
PyCharm should now be configured for debugging.
Set up unit tests
Go to Settings (Ctrl + Alt + S) > Tools > Python Integrated Tools.
Then under the header "Testing" change the Default test runner to Unittests (not PyTest nor Autodetect) and hit "OK" to save the changes.
Debugging in a Docker container using PyCharm is only possible with the PyCharm Professional edition.
Configure the Python interpreter
Bottom right > add interpreter > Docker
- Server:
Docker - image name:
python:3.14-trixie(change the number if you use a different Python version)
Set up debugging
Within the app directory, go to the .idea add another directory named runConfigurations and add a file named VIKTOR_Debug.xml:
my-app-folder
└── .idea
    └── runConfigurations
        └── VIKTOR_Debug.xml
Inside this file, add the XML provided in the snippet below. Make sure to replace <APP_FOLDER_NAME> with the directory
name of your app folder (e.g. my-app-folder in the example), this can be found on the highlighted line.
<component name="ProjectRunConfigurationManager">
  <configuration default="false" name="VIKTOR Debug" type="PythonConfigurationType" factoryName="Python">
    <module name="viktor-docker" />
    <option name="INTERPRETER_OPTIONS" value="" />
    <option name="PARENT_ENVS" value="true" />
    <envs>
      <env name="PYTHONUNBUFFERED" value="1" />
    </envs>
    <option name="SDK_HOME" value="" />
    <option name="WORKING_DIRECTORY" value="$PROJECT_DIR$" />
    <option name="IS_MODULE_SDK" value="true" />
    <option name="ADD_CONTENT_ROOTS" value="true" />
    <option name="ADD_SOURCE_ROOTS" value="true" />
    <EXTENSION ID="DockerContainerSettingsRunConfigurationExtension">
      <option name="envVars">
        <list>
          <DockerEnvVarImpl>
            <option name="name" value="PYTHONPATH" />
            <option name="value" value="/usr/src/app:/usr/src/packages" />
          </DockerEnvVarImpl>
        </list>
      </option>
      <option name="extraHosts">
        <list />
      </option>
      <option name="links">
        <list />
      </option>
      <option name="networkDisabled" value="false" />
      <option name="networkMode" value="bridge" />
      <option name="portBindings">
        <list />
      </option>
      <option name="publishAllPorts" value="false" />
      <option name="runCliOptions" value="--entrypoint= --rm" />
      <option name="version" value="2" />
      <option name="volumeBindings">
        <list>
          <DockerVolumeBindingImpl>
            <option name="containerPath" value="/usr/src/app" />
            <option name="editable" value="true" />
            <option name="hostPath" value="$PROJECT_DIR$" />
            <option name="readOnly" value="false" />
          </DockerVolumeBindingImpl>
          <DockerVolumeBindingImpl>
            <option name="containerPath" value="/root/.viktor" />
            <option name="editable" value="true" />
            <option name="hostPath" value="$USER_HOME$/.viktor" />
            <option name="readOnly" value="false" />
          </DockerVolumeBindingImpl>
          <DockerVolumeBindingImpl>
            <option name="containerPath" value="/usr/src/packages" />
            <option name="editable" value="true" />
            <option name="hostPath" value="$USER_HOME$/.viktor/viktor-installs/<APP_FOLDER_NAME>-specific/pip-cache" />
            <option name="readOnly" value="false" />
          </DockerVolumeBindingImpl>
        </list>
      </option>
    </EXTENSION>
    <EXTENSION ID="PythonCoverageRunConfigurationExtension" runner="coverage.py" />
    <PathMappingSettings>
      <option name="pathMappings">
        <list>
          <mapping local-root="$PROJECT_DIR$" remote-root="/usr/src/app" />
        </list>
      </option>
    </PathMappingSettings>
    <option name="SCRIPT_NAME" value="viktor_debugging" />
    <option name="PARAMETERS" value="" />
    <option name="SHOW_COMMAND_LINE" value="false" />
    <option name="EMULATE_TERMINAL" value="false" />
    <option name="MODULE_MODE" value="true" />
    <option name="REDIRECT_INPUT" value="false" />
    <option name="INPUT_FILE" value="" />
    <method v="2" />
  </configuration>
</component>
PyCharm should now be configured for debugging.
Set up unit tests
Configure using Unittests (not PyTest nor Autodetect) in Settings (Ctrl + Alt + S) > Tools > Python Integrated Tools > Testing > Default test runner
Within the app directory, go to the .idea add another directory named runConfigurations and create a file _template__of_Unittests.xml:
my-app-folder
└── .idea
    └── runConfigurations
        ├── VIKTOR_Debug.xml
        └── _template__of_Unittests.xml
Inside this file, add the XML provided in the snippet below. Make sure to replace <APP_FOLDER_NAME> with the directory
name of your app folder (e.g. my-app-folder in the example), this can be found on the highlighted line.
<component name="ProjectRunConfigurationManager">
<configuration default="true" type="tests" factoryName="Unittests">
<module name="viktor-docker" />
<option name="INTERPRETER_OPTIONS" value="" />
<option name="PARENT_ENVS" value="true" />
<option name="WORKING_DIRECTORY" value="/usr/src/app" />
<option name="IS_MODULE_SDK" value="false" />
<option name="ADD_CONTENT_ROOTS" value="true" />
<option name="ADD_SOURCE_ROOTS" value="true" />
<EXTENSION ID="DockerContainerSettingsRunConfigurationExtension">
<option name="envVars">
<list>
<DockerEnvVarImpl>
<option name="name" value="PYTHONPATH" />
<option name="value" value="/usr/src/app:/usr/src/packages" />
</DockerEnvVarImpl>
</list>
</option>
<option name="extraHosts">
<list />
</option>
<option name="links">
<list />
</option>
<option name="networkDisabled" value="false" />
<option name="networkMode" value="bridge" />
<option name="portBindings">
<list />
</option>
<option name="publishAllPorts" value="false" />
<option name="runCliOptions" value="--entrypoint= --rm" />
<option name="version" value="2" />
<option name="volumeBindings">
<list>
<DockerVolumeBindingImpl>
<option name="containerPath" value="/usr/src/app" />
<option name="editable" value="true" />
<option name="hostPath" value="$PROJECT_DIR$" />
<option name="readOnly" value="false" />
</DockerVolumeBindingImpl>
<DockerVolumeBindingImpl>
<option name="containerPath" value="/usr/src/packages" />
<option name="editable" value="true" />
<option name="hostPath" value="$USER_HOME$/.viktor/viktor-installs/<APP_FOLDER_NAME>-specific/pip-cache" />
<option name="readOnly" value="false" />
</DockerVolumeBindingImpl>
</list>
</option>
</EXTENSION>
<EXTENSION ID="PythonCoverageRunConfigurationExtension" runner="coverage.py" />
<PathMappingSettings>
<option name="pathMappings">
<list>
<mapping local-root="$PROJECT_DIR$" remote-root="/usr/src/app" />
</list>
</option>
</PathMappingSettings>
<option name="_new_pattern" value="""" />
<option name="_new_additionalArguments" value="""" />
<option name="_new_target" value="""" />
<option name="_new_targetType" value=""PATH"" />
<method v="2" />
</configuration>
</component>
Restart PyCharm to make sure the configuration is loaded properly.
Debugging in a Docker container using PyCharm is only possible with the PyCharm Professional edition.
Configure the Python interpreter
Bottom right > add interpreter > Docker
- Server:
Docker - image name:
python:3.14-trixie(change the number if you use a different Python version)
Set up debugging
Within the app directory, go to the .idea add another directory named runConfigurations and add a file named VIKTOR_Debug.xml:
my-app-folder
└── .idea
    └── runConfigurations
        └── VIKTOR_Debug.xml
Inside this file, add the XML provided in the snippet below. Make sure to replace <APP_FOLDER_NAME> with the directory name of your app folder (e.g. my-app-folder in the example) and replace <PATH_TO_WSL_HOMEDIR> with the Windows path to the WSL user home directory (will look something like //wsl$/Ubuntu/home/<username>). Both can be found on the highlighted line.
<component name="ProjectRunConfigurationManager">
  <configuration default="false" name="VIKTOR Debug" type="PythonConfigurationType" factoryName="Python">
    <module name="viktor-docker" />
    <option name="INTERPRETER_OPTIONS" value="" />
    <option name="PARENT_ENVS" value="true" />
    <envs>
      <env name="PYTHONUNBUFFERED" value="1" />
    </envs>
    <option name="WORKING_DIRECTORY" value="$PROJECT_DIR$" />
    <option name="IS_MODULE_SDK" value="false" />
    <option name="ADD_CONTENT_ROOTS" value="true" />
    <option name="ADD_SOURCE_ROOTS" value="true" />
    <EXTENSION ID="DockerContainerSettingsRunConfigurationExtension">
      <option name="envVars">
        <list>
          <DockerEnvVarImpl>
            <option name="name" value="PYTHONPATH" />
            <option name="value" value="/usr/src/app:/usr/src/packages" />
          </DockerEnvVarImpl>
        </list>
      </option>
      <option name="extraHosts">
        <list />
      </option>
      <option name="links">
        <list />
      </option>
      <option name="networkDisabled" value="false" />
      <option name="networkMode" value="bridge" />
      <option name="portBindings">
        <list />
      </option>
      <option name="publishAllPorts" value="false" />
      <option name="runCliOptions" value="--entrypoint= --rm" />
      <option name="version" value="2" />
      <option name="volumeBindings">
        <list>
          <DockerVolumeBindingImpl>
            <option name="containerPath" value="/usr/src/app" />
            <option name="editable" value="true" />
            <option name="hostPath" value="$PROJECT_DIR$" />
            <option name="readOnly" value="false" />
          </DockerVolumeBindingImpl>
          <DockerVolumeBindingImpl>
            <option name="containerPath" value="/root/.viktor" />
            <option name="editable" value="true" />
            <option name="hostPath" value="<PATH_TO_WSL_HOMEDIR>/.viktor" />
            <option name="readOnly" value="false" />
          </DockerVolumeBindingImpl>
          <DockerVolumeBindingImpl>
            <option name="containerPath" value="/usr/src/packages" />
            <option name="editable" value="true" />
            <option name="hostPath" value="<PATH_TO_WSL_HOMEDIR>/.viktor/viktor-installs/<APP_FOLDER_NAME>-specific/pip-cache" />
            <option name="readOnly" value="false" />
          </DockerVolumeBindingImpl>
        </list>
      </option>
    </EXTENSION>
    <EXTENSION ID="PythonCoverageRunConfigurationExtension" runner="coverage.py" />
    <PathMappingSettings>
      <option name="pathMappings">
        <list>
          <mapping local-root="$PROJECT_DIR$" remote-root="/usr/src/app" />
        </list>
      </option>
    </PathMappingSettings>
    <option name="SCRIPT_NAME" value="viktor_debugging" />
    <option name="PARAMETERS" value="" />
    <option name="SHOW_COMMAND_LINE" value="false" />
    <option name="EMULATE_TERMINAL" value="false" />
    <option name="MODULE_MODE" value="true" />
    <option name="REDIRECT_INPUT" value="false" />
    <option name="INPUT_FILE" value="" />
    <method v="2" />
  </configuration>
</component>
PyCharm should now be configured for debugging.
Set up unit tests
Configure using Unittests (not PyTest nor Autodetect) in Settings (Ctrl + Alt + S) > Tools > Python Integrated Tools > Testing > Default test runner
Within the app directory, go to the .idea add another directory named runConfigurations and create a file _template__of_Unittests.xml:
my-app-folder
└── .idea
    └── runConfigurations
        ├── VIKTOR_Debug.xml
        └── _template__of_Unittests.xml
Inside this file, add the XML provided in the snippet below. Make sure to replace <APP_FOLDER_NAME> with the directory name of your app folder (e.g. my-app-folder in the example) and replace <PATH_TO_WSL_HOMEDIR> with the Windows path to the WSL user home directory (could be something like /Ubuntu/home/username). Both can be found on the highlighted line.
<component name="ProjectRunConfigurationManager">
<configuration default="true" type="tests" factoryName="Unittests">
<module name="viktor-docker" />
<option name="INTERPRETER_OPTIONS" value="" />
<option name="PARENT_ENVS" value="true" />
<option name="WORKING_DIRECTORY" value="/usr/src/app" />
<option name="IS_MODULE_SDK" value="false" />
<option name="ADD_CONTENT_ROOTS" value="true" />
<option name="ADD_SOURCE_ROOTS" value="true" />
<EXTENSION ID="DockerContainerSettingsRunConfigurationExtension">
<option name="envVars">
<list>
<DockerEnvVarImpl>
<option name="name" value="PYTHONPATH" />
<option name="value" value="/usr/src/app:/usr/src/packages" />
</DockerEnvVarImpl>
</list>
</option>
<option name="extraHosts">
<list />
</option>
<option name="links">
<list />
</option>
<option name="networkDisabled" value="false" />
<option name="networkMode" value="bridge" />
<option name="portBindings">
<list />
</option>
<option name="publishAllPorts" value="false" />
<option name="runCliOptions" value="--entrypoint= --rm" />
<option name="version" value="2" />
<option name="volumeBindings">
<list>
<DockerVolumeBindingImpl>
<option name="containerPath" value="/usr/src/app" />
<option name="editable" value="true" />
<option name="hostPath" value="$PROJECT_DIR$" />
<option name="readOnly" value="false" />
</DockerVolumeBindingImpl>
<DockerVolumeBindingImpl>
<option name="containerPath" value="/usr/src/packages" />
<option name="editable" value="true" />
<option name="hostPath" value="<PATH_TO_WSL_HOMEDIR>/.viktor/viktor-installs/<APP_FOLDER_NAME>-specific/pip-cache" />
<option name="readOnly" value="false" />
</DockerVolumeBindingImpl>
</list>
</option>
</EXTENSION>
<EXTENSION ID="PythonCoverageRunConfigurationExtension" runner="coverage.py" />
<PathMappingSettings>
<option name="pathMappings">
<list>
<mapping local-root="$PROJECT_DIR$" remote-root="/usr/src/app" />
</list>
</option>
</PathMappingSettings>
<option name="_new_pattern" value="""" />
<option name="_new_additionalArguments" value="""" />
<option name="_new_target" value="""" />
<option name="_new_targetType" value=""PATH"" />
<method v="2" />
</configuration>
</component>
Restart PyCharm to make sure the configuration is loaded properly.
- Virtual environment
- Docker (Hyper-V)
- Docker (WSL)
Configure the Python interpreter
Install the Python extension for VS Code (in extensions menu (Ctrl+Shift+X) you can search for ms-python.python)
Open the command pallette (Ctrl + Shift + P), and search for Python: Select Interpreter. Then select Python <X.X.X> .\venv\Scripts\python.exe.
Set up debugging
In the top menu, click Run > Add configuration.... Select
PythonModule- Enter
viktor_debugging
Now a launch.json file should be created containing the following: (if you like, you can change the name to VIKTOR Debug)
{
    "version": "0.2.0",
    "configurations": [
        {
            "name": "VIKTOR Debug",
            "type": "python",
            "request": "launch",
            "module": "viktor_debugging",
            "justMyCode": true
        }
    ]
}
VS Code should now be configured for debugging.
Unit tests
Configure using unittest:
Open command pallette: Ctrl + Shift + P, and search for Python: Configure Tests. Then select
unittestto configure the test runnerteststo configure what folder the tests can be foundtest*.pyto so that all files starting with "test" are selected
Install extensions
Install the Python and Docker extensions for VS Code (in extensions menu (Ctrl+Shift+X) you can search for ms-python.python and ms-azuretools.vscode-docker)
Set up debugging
Within the app directory, add another directory named .vscode and add a two files named launch.json and tasks.json:
my-app-folder
└── .vscode
    ├── launch.json
    └── tasks.json
Inside the launch.json file, add the following content:
{
    "version": "0.2.0",
    "configurations": [
        {
            "name": "VIKTOR Debug",
            "type": "docker",
            "request": "launch",
            "preLaunchTask": "docker-run: debug",
            "python": {
                "pathMappings": [
                    {
                        "localRoot": "${workspaceFolder}","remoteRoot": "/usr/src/app"
                    }
                ],
                "projectType": "general",
            }
        },
        {
            "name": "Unittest",
            "type": "docker",
            "request": "launch",
            "preLaunchTask": "docker-run: test",
            "python": {
                "pathMappings": [
                    {
                        "localRoot": "${workspaceFolder}","remoteRoot": "/usr/src/app"
                    }
                ],
                "projectType": "general",
            }
        }
    ]
}
And inside the tasks.json add the following content. If you use a python version different from 3.14, change the
number on the highlighted lines:
{
    "version": "2.0.0",
    "tasks": [
        {
            "label": "docker-run: debug",
            "type": "docker-run",
            "python": { "module": "viktor_debugging" },
            "dockerRun": {
                "network": "host",
                "containerName": "viktor-container",
                "image": "python:3.14-trixie",
                "remove": true,
                "env": {
                    "PYTHONPATH": "/usr/src/app:/usr/src/packages",
                    "PYTHONUNBUGGERED": "1",
                    "PYTHONDONTWRITEBYTECODE": "1"
                },
                "customOptions": "-w /usr/src/app",
                "volumes": [
                    {"containerPath": "/usr/src/app", "localPath": "${workspaceFolder}"},
                    {"containerPath": "/root/.viktor", "localPath": "${env:USERPROFILE}/.viktor"},
                    {"containerPath": "/usr/src/packages", "localPath": "${env:USERPROFILE}/.viktor/viktor-installs/${workspaceFolderBasename}-specific/pip-cache"}
                ]
            }
        },
        {
            "label": "docker-run: test",
            "type": "docker-run",
            "python": { "module": "unittest", "args": ["discover", "-s", "tests", "-v"] },
            "dockerRun": {
                "network": "host",
                "containerName": "viktor-container",
                "image": "python:3.14-trixie",
                "remove": true,
                "env": {
                    "PYTHONPATH": "/usr/src/app:/usr/src/packages",
                    "PYTHONUNBUGGERED": "1",
                    "PYTHONDONTWRITEBYTECODE": "1"
                },
                "customOptions": "-w /usr/src/app",
                "volumes": [
                    {"containerPath": "/usr/src/app", "localPath": "${workspaceFolder}"},
                    {"containerPath": "/root/.viktor", "localPath": "${env:USERPROFILE}/.viktor"},
                    {"containerPath": "/usr/src/packages", "localPath": "${env:USERPROFILE}/.viktor/viktor-installs/${workspaceFolderBasename}-specific/pip-cache"}
                ]
            }
        }
    ]
}
VS Code should now be configured for debugging and testing.
Install extensions
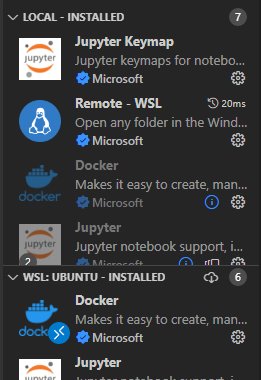
Install the "Remote - WSL", "Python" and "Docker" extensions for VS Code (in extensions menu (Ctrl+Shift+X) you can search for ms-vscode-remote.remote-wsl, ms-python.python and ms-azuretools.vscode-docker).
Next, click the green "Remote window" button in the bottom left corner of the window (see image below) and click "New WSL Window" to connect VS Code to a WSL development environment. This may take a while. Once connected, you should see "WSL: Ubuntu" in the bottom left corner.

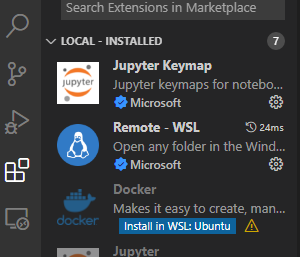
Then, in the WSL Development environment, you should again install the "Python" and "Docker" extensions for VS Code (in extensions menu (Ctrl+Shift+X) you can search for ms-python.python and ms-azuretools.vscode-docker, or you can use the "Install in WSL: Ubuntu" button, see screenshot).
To check the extensions are installed in WSL, you may need to expand the "WSL: Ubuntu" section.
Then open your project by chosing from the top menu: File > Open Folder and select the project. Do not use the recently opened links, as they will open the project ouside of the WSL development environment.
Lastly, in a WSL terminal, run sudo apt install python-is-python3 to make sure that the Python debugger of VS Code can find the correct python version in the WSL environment.
Set up debugging
Within the app directory, add another directory named .vscode and add a two files named launch.json and tasks.json:
my-app-folder
└── .vscode
    ├── launch.json
    └── tasks.json
Inside the launch.json file, add the following content:
{
    "version": "0.2.0",
    "configurations": [
        {
            "name": "VIKTOR Debug",
            "type": "docker",
            "request": "launch",
            "preLaunchTask": "docker-run: debug",
            "python": {
                "pathMappings": [
                    {
                        "localRoot": "${workspaceFolder}","remoteRoot": "/usr/src/app"
                    }
                ],
                "projectType": "general",
            }
        },
        {
            "name": "Unittest",
            "type": "docker",
            "request": "launch",
            "preLaunchTask": "docker-run: test",
            "python": {
                "pathMappings": [
                    {
                        "localRoot": "${workspaceFolder}","remoteRoot": "/usr/src/app"
                    }
                ],
                "projectType": "general",
            }
        }
    ]
}
And inside the tasks.json add the following content. If you use a python version different from 3.14, change the
number on the highlighted lines:
{
    "version": "2.0.0",
    "tasks": [
        {
            "label": "docker-run: debug",
            "type": "docker-run",
            "python": { "module": "viktor_debugging" },
            "dockerRun": {
                "network": "host",
                "containerName": "viktor-container",
                "image": "python:3.14-trixie",
                "remove": true,
                "env": {
                    "PYTHONPATH": "/usr/src/app:/usr/src/packages",
                    "PYTHONUNBUGGERED": "1",
                    "PYTHONDONTWRITEBYTECODE": "1"
                },
                "customOptions": "-w /usr/src/app",
                "volumes": [
                    {"containerPath": "/usr/src/app", "localPath": "${workspaceFolder}"},
                    {"containerPath": "/root/.viktor", "localPath": "${userHome}/.viktor"},
                    {"containerPath": "/usr/src/packages", "localPath": "${userHome}/.viktor/viktor-installs/${workspaceFolderBasename}-specific/pip-cache"}
                ]
            }
        },
        {
            "label": "docker-run: test",
            "type": "docker-run",
            "python": { "module": "unittest", "args": ["discover", "-s", "tests", "-v"] },
            "dockerRun": {
                "network": "host",
                "containerName": "viktor-container",
                "image": "python:3.14-trixie",
                "remove": true,
                "env": {
                    "PYTHONPATH": "/usr/src/app:/usr/src/packages",
                    "PYTHONUNBUGGERED": "1",
                    "PYTHONDONTWRITEBYTECODE": "1"
                },
                "customOptions": "-w /usr/src/app",
                "volumes": [
                    {"containerPath": "/usr/src/app", "localPath": "${workspaceFolder}"},
                    {"containerPath": "/root/.viktor", "localPath": "${userHome}/.viktor"},
                    {"containerPath": "/usr/src/packages", "localPath": "${userHome}/.viktor/viktor-installs/${workspaceFolderBasename}-specific/pip-cache"}
                ]
            }
        }
    ]
}
VS Code should now be configured for debugging and testing.
- PyCharm
- VS Code
- Virtual environment
- Docker
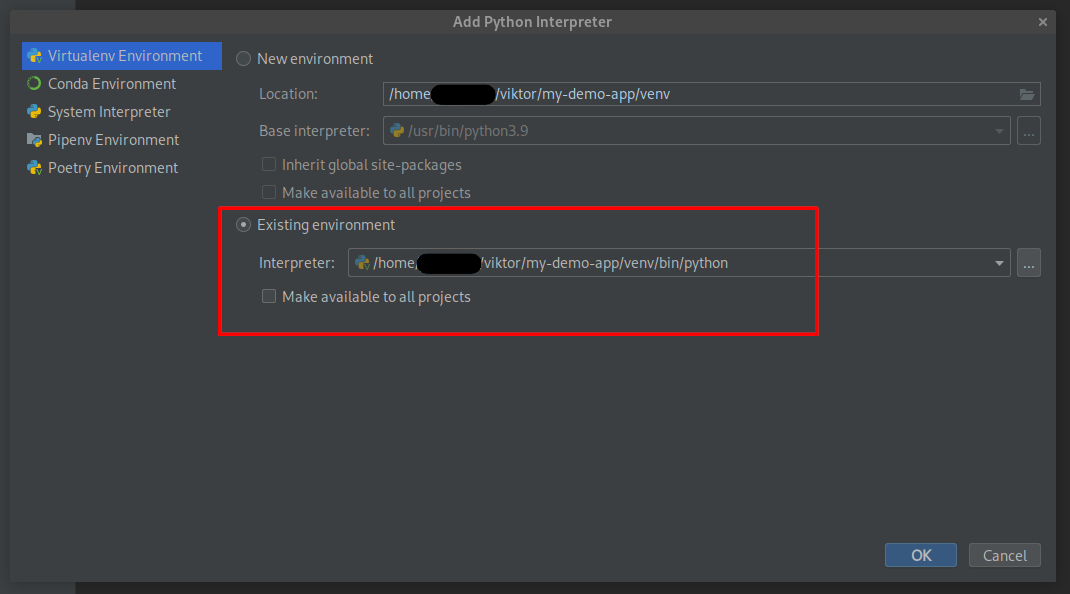
Configure the Python interpreter
In the bottom right, add a Python interpreter by clicking the Python 3.X (or <no interpreter>) button, followed by add interpreter.
In the bottom right, add a Python interpreter by clicking the Python 3.X (or <no interpreter>) button, followed by add interpreter.
Then select "existing environment", usually this is selected automatically. Then select the Python interpreter in <project-name>/venv/bin/python folder if it is not already selected. Click "ok" to save the settings.
Set up debugging
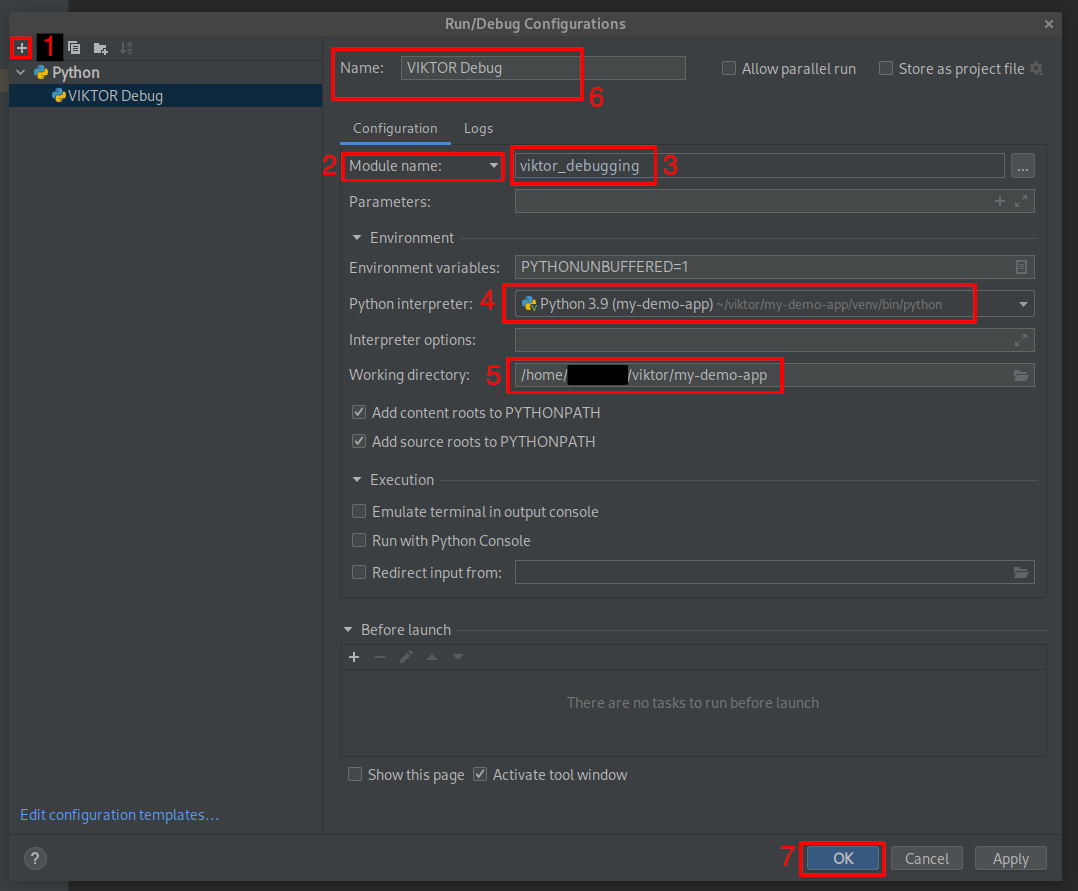
Next, in the top menu, click Run > Edit configurations.
A modal will appear where you can create new debug configurations. Then follow these steps:
- Click the
+in the top-left and from the dropdown selectPythonto create a new debug configuration - Change
Script pathtoModule name - Type
viktor_debuggingin the field for the module name - Select the Python interpreter you just configured
- Change the working directory to the project directory.
- (optionally) give the configuration a name, such as "VIKTOR Debug"
- Click
okto save the debug configuration
PyCharm should now be configured for debugging.
Unit tests
Go to Settings (Ctrl + Alt + S) > Tools > Python Integrated Tools.
Then under the header "Testing" change the Default test runner to Unittests (not PyTest nor Autodetect) and hit "OK" to save the changes.
Debugging in a Docker container using PyCharm is only possible with the PyCharm Professional edition.
Configure the Python interpreter
Bottom right > add interpreter > Docker
- Server:
Docker(unix sock) - image name:
python:3.14-trixie(change the number if you use a different Python version)
Debug configuration
Within the app directory, add another directory named .run and add a file named debug.run.xml:
my-app-folder
└── .run
    └── debug.run.xml
Inside this file, add the XML provided in the snippet below. Make sure to replace <APP_FOLDER_NAME> with the directory
name of your app folder (e.g. my-app-folder in the example), this can be found on the highlighted line.
<component name="ProjectRunConfigurationManager">
  <configuration default="false" name="VIKTOR Debug" type="PythonConfigurationType" factoryName="Python">
    <module name="viktor-debugging" />
    <option name="INTERPRETER_OPTIONS" value="" />
    <option name="PARENT_ENVS" value="true" />
    <envs>
      <env name="PYTHONUNBUFFERED" value="1" />
      <env name="PYTHONPATH" value="/usr/src/packages" />
    </envs>
    <option name="SDK_HOME" value="" />
    <option name="WORKING_DIRECTORY" value="/usr/src/app" />
    <option name="IS_MODULE_SDK" value="true" />
    <option name="ADD_CONTENT_ROOTS" value="true" />
    <option name="ADD_SOURCE_ROOTS" value="true" />
    <EXTENSION ID="DockerContainerSettingsRunConfigurationExtension">
      <option name="envVars">
        <list>
          <DockerEnvVarImpl>
            <option name="name" value="PYTHONPATH" />
            <option name="value" value="/usr/src/app:/usr/src/packages" />
          </DockerEnvVarImpl>
        </list>
      </option>
      <option name="extraHosts">
        <list />
      </option>
      <option name="links">
        <list />
      </option>
      <option name="networkDisabled" value="false" />
      <option name="networkMode" value="host" />
      <option name="portBindings">
        <list />
      </option>
      <option name="publishAllPorts" value="false" />
      <option name="runCliOptions" value="--rm" />
      <option name="version" value="2" />
      <option name="volumeBindings">
        <list>
          <DockerVolumeBindingImpl>
            <option name="containerPath" value="/usr/src/app" />
            <option name="editable" value="true" />
            <option name="hostPath" value="$PROJECT_DIR$" />
            <option name="readOnly" value="true" />
          </DockerVolumeBindingImpl>
          <DockerVolumeBindingImpl>
            <option name="containerPath" value="/usr/src/packages" />
            <option name="editable" value="true" />
            <option name="hostPath" value="$USER_HOME$/.viktor/viktor-installs/<APP_FOLDER_NAME>-specific/pip-cache" />
            <option name="readOnly" value="true" />
          </DockerVolumeBindingImpl>
          <DockerVolumeBindingImpl>
            <option name="containerPath" value="/root/.viktor" />
            <option name="editable" value="true" />
            <option name="hostPath" value="$USER_HOME$/.viktor" />
            <option name="readOnly" value="true" />
          </DockerVolumeBindingImpl>
        </list>
      </option>
    </EXTENSION>
    <EXTENSION ID="PythonCoverageRunConfigurationExtension" runner="coverage.py" />
    <option name="SCRIPT_NAME" value="viktor_debugging" />
    <option name="PARAMETERS" value="" />
    <option name="SHOW_COMMAND_LINE" value="false" />
    <option name="EMULATE_TERMINAL" value="false" />
    <option name="MODULE_MODE" value="true" />
    <option name="REDIRECT_INPUT" value="false" />
    <option name="INPUT_FILE" value="" />
    <method v="2" />
  </configuration>
</component>
PyCharm should now be configured for debugging, to start debugging.
Unit tests
Configure using Unittests (not PyTest nor Autodetect) in Settings (ctrl + alt + s) > Tools > Python Integrated Tools > Testing > Default test runner
And create a Template Python tests.run.xml
my-app-folder
└── .run
    ├── debug.run.xml
    └── Template Python tests.run.xml
Inside this file, add the XML provided in the snippet below. Make sure to replace <APP_FOLDER_NAME> with the directory
name of your app folder (e.g. my-app-folder in the example), this can be found on the highlighted line.
<component name="ProjectRunConfigurationManager">
<configuration default="true" type="tests" factoryName="Unittests">
<module name="debuggable-viktor-app-2" />
<option name="INTERPRETER_OPTIONS" value="" />
<option name="PARENT_ENVS" value="true" />
<envs>
<env name="PYTHONPATH" value="/usr/src/packages" />
</envs>
<option name="WORKING_DIRECTORY" value="/usr/src/app" />
<option name="IS_MODULE_SDK" value="false" />
<option name="ADD_CONTENT_ROOTS" value="true" />
<option name="ADD_SOURCE_ROOTS" value="true" />
<EXTENSION ID="DockerContainerSettingsRunConfigurationExtension">
<option name="envVars">
<list>
<DockerEnvVarImpl>
<option name="name" value="PYTHONPATH" />
<option name="value" value="/usr/src/app:/usr/src/packages" />
</DockerEnvVarImpl>
</list>
</option>
<option name="extraHosts">
<list />
</option>
<option name="links">
<list />
</option>
<option name="networkDisabled" value="false" />
<option name="networkMode" value="bridge" />
<option name="portBindings">
<list />
</option>
<option name="publishAllPorts" value="false" />
<option name="runCliOptions" value="--entrypoint= --rm" />
<option name="version" value="2" />
<option name="volumeBindings">
<list>
<DockerVolumeBindingImpl>
<option name="containerPath" value="/usr/src/app" />
<option name="editable" value="true" />
<option name="hostPath" value="$PROJECT_DIR$" />
<option name="readOnly" value="false" />
</DockerVolumeBindingImpl>
<DockerVolumeBindingImpl>
<option name="containerPath" value="/usr/src/packages" />
<option name="editable" value="true" />
<option name="hostPath" value="$USER_HOME$/.viktor/viktor-installs/<APP_FOLDER_NAME>-specific/pip-cache" />
<option name="readOnly" value="false" />
</DockerVolumeBindingImpl>
</list>
</option>
</EXTENSION>
<EXTENSION ID="PythonCoverageRunConfigurationExtension" runner="coverage.py" />
<option name="_new_pattern" value="""" />
<option name="_new_additionalArguments" value="""" />
<option name="_new_target" value="""" />
<option name="_new_targetType" value=""PATH"" />
<method v="2" />
</configuration>
</component>
Restart PyCharm to make sure the configuration is loaded properly.
- Virtual environment
- Docker
Configure the Python interpreter
Install the "Python" extension (in extensions menu (Ctrl+Shift+X) you can search for ms-python.python)
Open command pallette: Ctrl + Shift + P, and search for Python: Select Interpreter. Then select Python <X.X.X> ('venv': venv) ./venv/bin/python.
Set up debugging
In the top menu, click Run > Add configuration.... Select
PythonModule- Enter
viktor_debugging
Now a launch.json file should be created containing the following: (if you like, you can change the name to VIKTOR Debug)
{
    "version": "0.2.0",
    "configurations": [
        {
            "name": "VIKTOR Debug",
            "type": "python",
            "request": "launch",
            "module": "viktor_debugging",
            "justMyCode": true
        }
    ]
}
The code editor should now be configured for debugging.
Unit tests
Configure using unittest:
Open command pallette: Ctrl + Shift + P, and search for Python: Configure Tests. Then select
unittestto configure the test runnerteststo configure what folder the tests can be foundtest*.pyto so that all files starting with "test" are selected
Install extensions
Install the Python and Docker extensions for VS Code (in extensions menu (Ctrl+Shift+X) you can search for ms-python.python and ms-azuretools.vscode-docker)
Set up debugging
Within the app directory, add another directory named .vscode and add a two files named launch.json and tasks.json:
my-app-folder
└── .vscode
    ├── launch.json
    └── tasks.json
Inside the launch.json file, add the following content:
{
    "version": "0.2.0",
    "configurations": [
        {
            "name": "VIKTOR Debug",
            "type": "docker",
            "request": "launch",
            "preLaunchTask": "docker-run: debug",
            "python": {
                "pathMappings": [
                    {
                        "localRoot": "${workspaceFolder}",
                        "remoteRoot": "/usr/src/app"
                    }
                ],
                "projectType": "general",
            }
        },
        {
            "name": "Unittest",
            "type": "docker",
            "request": "launch",
            "preLaunchTask": "docker-run: test",
            "python": {
                "pathMappings": [
                    {
                        "localRoot": "${workspaceFolder}",
                        "remoteRoot": "/usr/src/app"
                    }
                ],
                "projectType": "general",
            }
        }
    ]
}
And inside the tasks.json add the following content:
If you use a python version different from 3.14, change the number on the highlighted lines.
{
    "version": "2.0.0",
    "tasks": [
        {
            "label": "docker-run: debug",
            "type": "docker-run",
            "python": { "module": "viktor_debugging" },
            "dockerRun": {
                "network": "host",
                "containerName": "viktor-container",
                "image": "python:3.14-trixie",
                "remove": true,
                "env": {
                    "PYTHONPATH": "/usr/src/app:/usr/src/packages",
                    "PYTHONUNBUGGERED": "1",
                    "PYTHONDONTWRITEBYTECODE": "1"
                },
                "customOptions": "-w /usr/src/app",
                "volumes": [
                    {"containerPath": "/usr/src/app", "localPath": "${workspaceFolder}"},
                    {"containerPath": "/root/.viktor", "localPath": "${env:HOME}/.viktor"},
                    {"containerPath": "/usr/src/packages", "localPath": "${env:HOME}/.viktor/viktor-installs/${workspaceFolderBasename}-specific/pip-cache"}
                ]
            }
        },
        {
            "label": "docker-run: test",
            "type": "docker-run",
            "python": { "module": "unittest", "args": ["discover", "-s", "tests", "-v"] },
            "dockerRun": {
                "network": "host",
                "containerName": "viktor-container",
                "image": "python:3.14-trixie",
                "remove": true,
                "env": {
                    "PYTHONPATH": "/usr/src/app:/usr/src/packages",
                    "PYTHONUNBUGGERED": "1",
                    "PYTHONDONTWRITEBYTECODE": "1"
                },
                "customOptions": "-w /usr/src/app",
                "volumes": [
                    {"containerPath": "/usr/src/app", "localPath": "${workspaceFolder}"},
                    {"containerPath": "/root/.viktor", "localPath": "${env:HOME}/.viktor"},
                    {"containerPath": "/usr/src/packages", "localPath": "${env:HOME}/.viktor/viktor-installs/${workspaceFolderBasename}-specific/pip-cache"}
                ]
            }
        }
    ]
}
VS Code should now be configured for debugging and running unit tests.
Configure the Python interpreter
Install the "Python" extension (in extensions menu (Ctrl+Shift+X) you can search for ms-python.python)
Open command pallette: Ctrl + Shift + P, and search for Python: Select Interpreter. Then select Python <X.X.X> ('venv': venv) ./venv/bin/python.
Set up debugging
In the top menu, click Run > Add configuration.... Select
PythonModule- Enter
viktor_debugging
Now a launch.json file should be created containing the following: (if you like, you can change the name to VIKTOR Debug)
{
    "version": "0.2.0",
    "configurations": [
        {
            "name": "VIKTOR Debug",
            "type": "python",
            "request": "launch",
            "module": "viktor_debugging",
            "justMyCode": true
        }
    ]
}
The code editor should now be configured for debugging.
Unit tests
Configure using unittest:
Open command pallette: Ctrl + Shift + P, and search for Python: Configure Tests. Then select
unittestto configure the test runnerteststo configure what folder the tests can be foundtest*.pyto so that all files starting with "test" are selected
Start the debugger
Before starting a debugging session, make sure that you are not running the app using the viktor-cli (close the
connection using Ctrl+C). To start the debugging session, use:
- PyCharm: In the top menu, click
Run > Debug... (Alt+Shift+F9)and select the debug configuration we just made. If it is already selected you can also useRun > Debug (VIKTOR Debug) (Shift+F9). - Visual Studio Code: In the top menu, click
Run > Start debugging... (F5).
Auto-reload is not possible in debug mode. Code changes only take effect after restarting the debugging session.
(pycharm: Ctrl+F5, vscode: Ctrl+Shift+F5)
Setting breakpoints
When the debugger is started, a terminal should appear at the bottom of your editor window, in which your app is started. You should be able to go to your personal dev url in a browser and use the app. You can set breakpoints in the code, and inspect the parameters at these points.
You can read more about setting breakpoints, stepping through code and reading variables in the documentation of the specific editors:
| PyCharm | VS Code |
|---|---|
| Set breakpoints in PyCharm | Set breakpoints in VS Code |
| Stepping through code in PyCharm | Stepping through code in VS Code |
| Reading variables in PyCharm | Reading variables in VS Code |
When writing a Python script, normally you will hit the breakpoints when you start the script. In a VIKTOR application however, the breakpoints will only be hit when the function is triggered by the user. For example, the code in a view function runs when the view is opened in the web browser.
Note that when debugging quick views or callback functions that are used for the parametrization, the editor will not respond when the call (including debugging time) takes longer than about 10 seconds.
When debugging views, you can (temporarily) set the duration_guess to some high number to require manual triggering
of the computation, leading to a nicer debug experience. This will also allow you to see the updated results in the web
browser once the call is finished.
Debugging tests
We assume your tests are located in the "tests" folder.
PyCharm
In the project explorer, right-click a test file or test directory and then Debug "Python tests in test...".
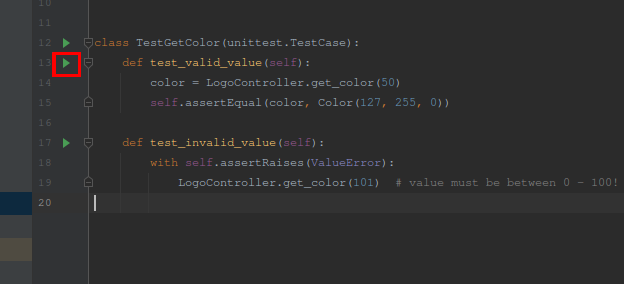
Alternatively, you can debug individual tests (or test classes) by opening a test file and clicking the play button in the gutter and then selecting Debug "Python tests in test...".
Visual Studio Code - venv
In the left panel, choose tests (the Erlenmeyer flask icon). You should see your tests listed there. In this panel you can hover a test file and click the run or debug icon.
Alternatively, you can debug individual tests by going to your test file and right-clicking the icon in the gutter next to the test function and selecting "Debug test".

Visual Studio Code - Docker
In the left menu, go to the debug panel (Ctrl+Shift+D) and at the top choose "Unittest". Click on the green arrow
next to it to debug the unit tests. This runs all unit tests.