Dive into data visualizations
In this task you will learn how to add graphs to your app. We will be creating a visualization to determine rental prices for a real estate development.
Set up the app template
When you start creating a new app the first thing you need to do is to create an app template. The steps depend on the installation method you chose before. Please select the correct tab before you continue.
- Local development
- GitHub Codespaces
-
Open the Codespace (only if you don't have it open yet)
-
In the terminal enter the following command to create the necessary files and hit enter:
viktor-cli create-app --app-type editor -
Install the app and its dependencies and connect it to the VIKTOR platform:
viktor-cli clean-start
If all went well and the app is connected you will see the VIKTOR logo in the terminal:
INFO    :  __      __ __  __  __
INFO    :  \ \    / / | | | |/ /
INFO    :   \ \  / /  | | | ' /
INFO    :    \ \/ /   | | |  <
INFO    :     \  /    | | | . \
INFO    :      \/     |_| |_|\_\
INFO    :   _______   ____    _____
INFO    :  |__   __| / __ \  |  __ \
INFO    :     | |   | |  | | | |__) |
INFO    :     | |   | |  | | |  _  /
INFO    :     | |   | |__| | | | \ \
INFO    :     |_|    \____/  |_|  \_\
INFO    : VIKTOR connector vX.Y.Z
INFO    : VIKTOR SDK vX.Y.Z
INFO    : Connecting to platform...
INFO    : Connection is established: <URL>  <---- here you can see your app
INFO    : The connection can be closed using Ctrl+C
INFO    : App is ready
Do not close the terminal as this will break the connection with your app.
-
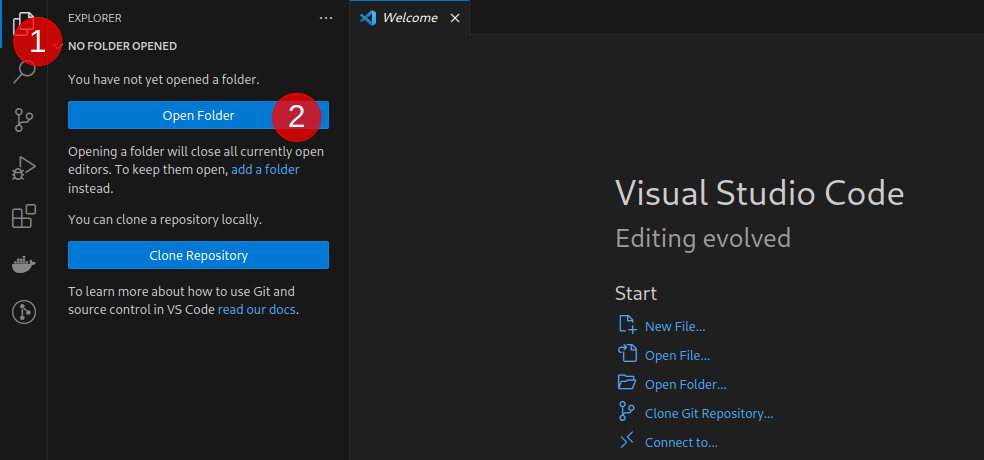
You will need a code editor to write the code of your app. Download and install a code editor if you don't have one installed on your computer. We recommend using VS Code or PyCharm.
-
Create a new folder on your computer that you will use to store the code of your app (e.g.
C:\Users\<username>\viktor-apps\my-app). -
Open your code editor and open the folder you just created in the previous step. Select the correct tab below and see how to do this in the code editor of your choice.
- VS Code
- PyCharm
-
Open a terminal in your code editor:
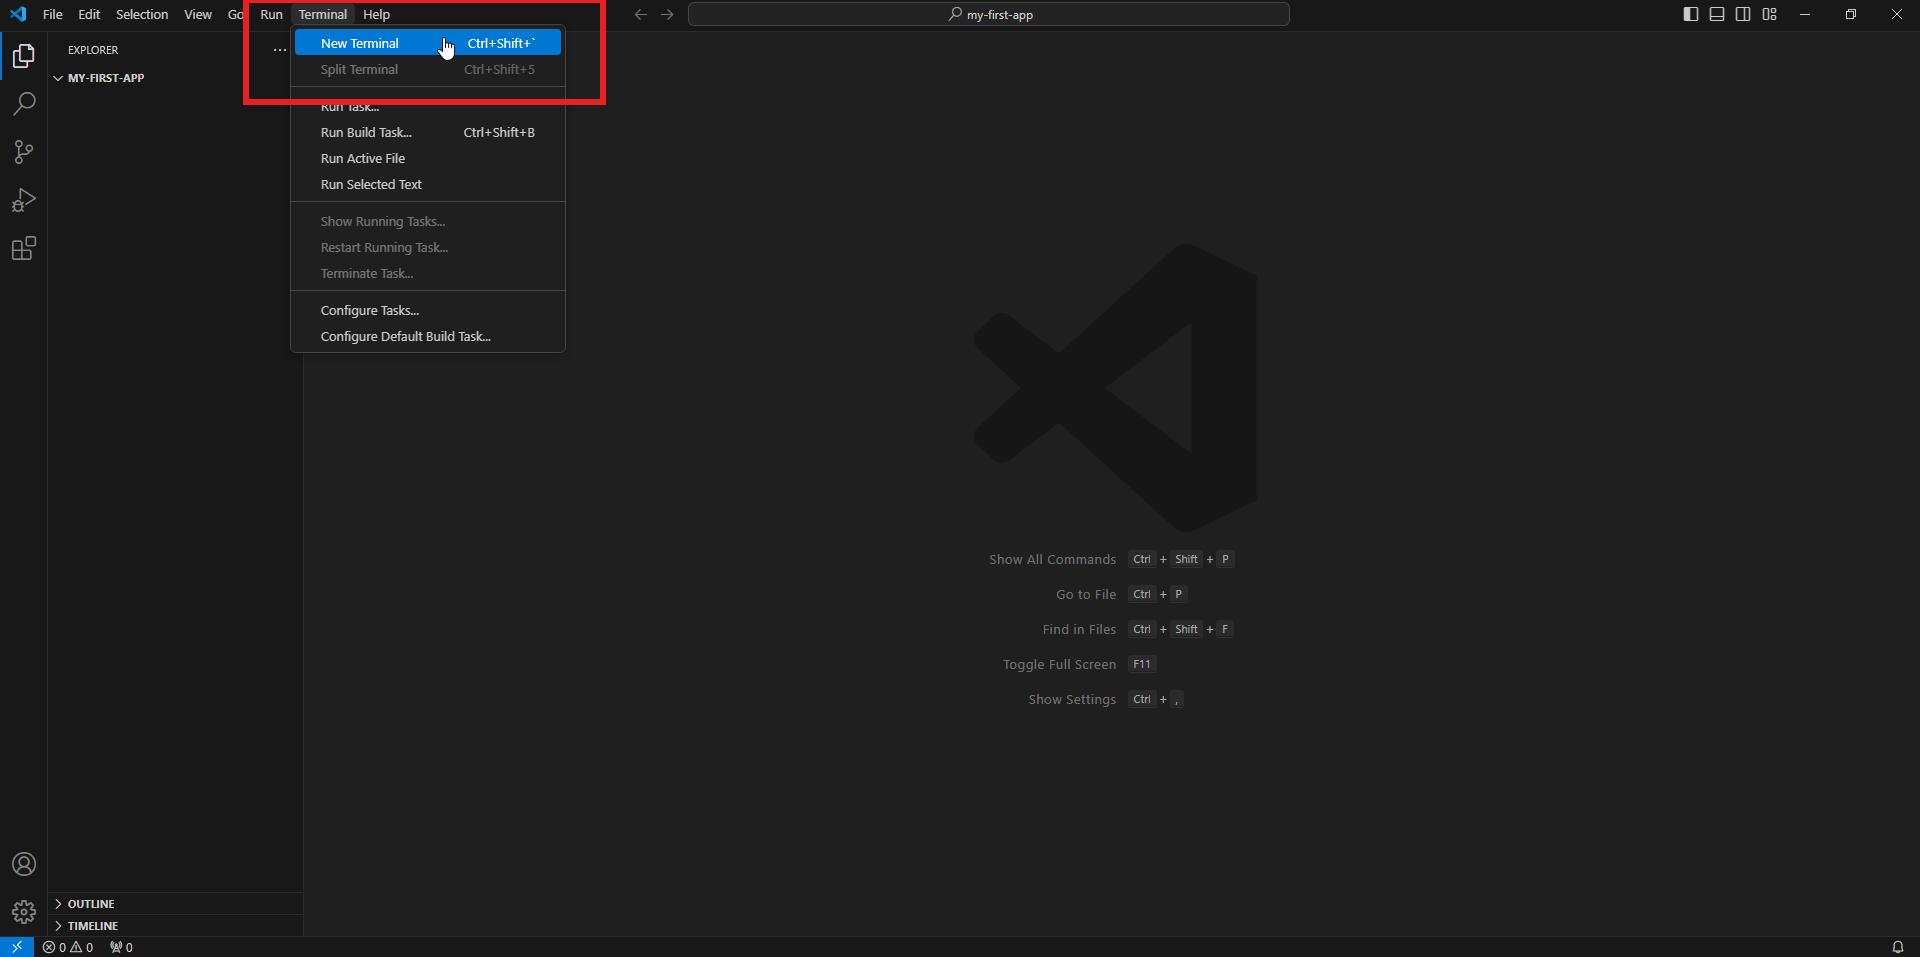
Inside that terminal enter the following command to generate the necessary app files and hit enter:
viktor-cli create-app --app-type editorviktor-cli not recognizedIf you activated your account, continued with the starter guide and installed a code editor in the same session you might encounter the following error:
viktor-cli : The term 'viktor-cli' is not recognized as the name of a cmdlet, function, script file, or operable program. Check the spelling of the name, or if a path was included, verify that the path
is correct and try again.
At line:1 char:1
+ viktor-cli
+ ~~~~~~~~~~
    + CategoryInfo          : ObjectNotFound: (viktor-cli:String) [], CommandNotFoundException
    + FullyQualifiedErrorId : CommandNotFoundException
You can solve this error by closing and restarting your code editor. After doing so you can run the command without any problems. The problem is caused because your code editor inherits the environment variables of the process that launched it and because you installed the VIKTOR CLI in the same session it requires a restart to be recognized properly.
-
Install the app and its dependencies and connect it to the VIKTOR platform by using the following command in the terminal:
viktor-cli clean-start
Running this command can take a few minutes. When the installation is complete you will see the following lines printed in the terminal. This means that the app is connected to the VIKTOR platform.
INFO    :  __      __ __  __  __
INFO    :  \ \    / / | | | |/ /
INFO    :   \ \  / /  | | | ' /
INFO    :    \ \/ /   | | |  <
INFO    :     \  /    | | | . \
INFO    :      \/     |_| |_|\_\
INFO    :   _______   ____    _____
INFO    :  |__   __| / __ \  |  __ \
INFO    :     | |   | |  | | | |__) |
INFO    :     | |   | |  | | |  _  /
INFO    :     | |   | |__| | | | \ \
INFO    :     |_|    \____/  |_|  \_\
INFO    : VIKTOR connector vX.Y.Z
INFO    : VIKTOR SDK vX.Y.Z
INFO    : Connecting to platform...
INFO    : Connection is established: <URL>  <---- here you can see your app
INFO    : The connection can be closed using Ctrl+C
INFO    : App is ready
Do not close the terminal as this will break the connection with your app.
-
Open a terminal in your code editor:

Inside that terminal enter the following command to generate the necessary app files and hit enter:
viktor-cli create-app --app-type editor -
Install the app and its dependencies and connect it to the VIKTOR platform by using the following command in the terminal:
viktor-cli clean-start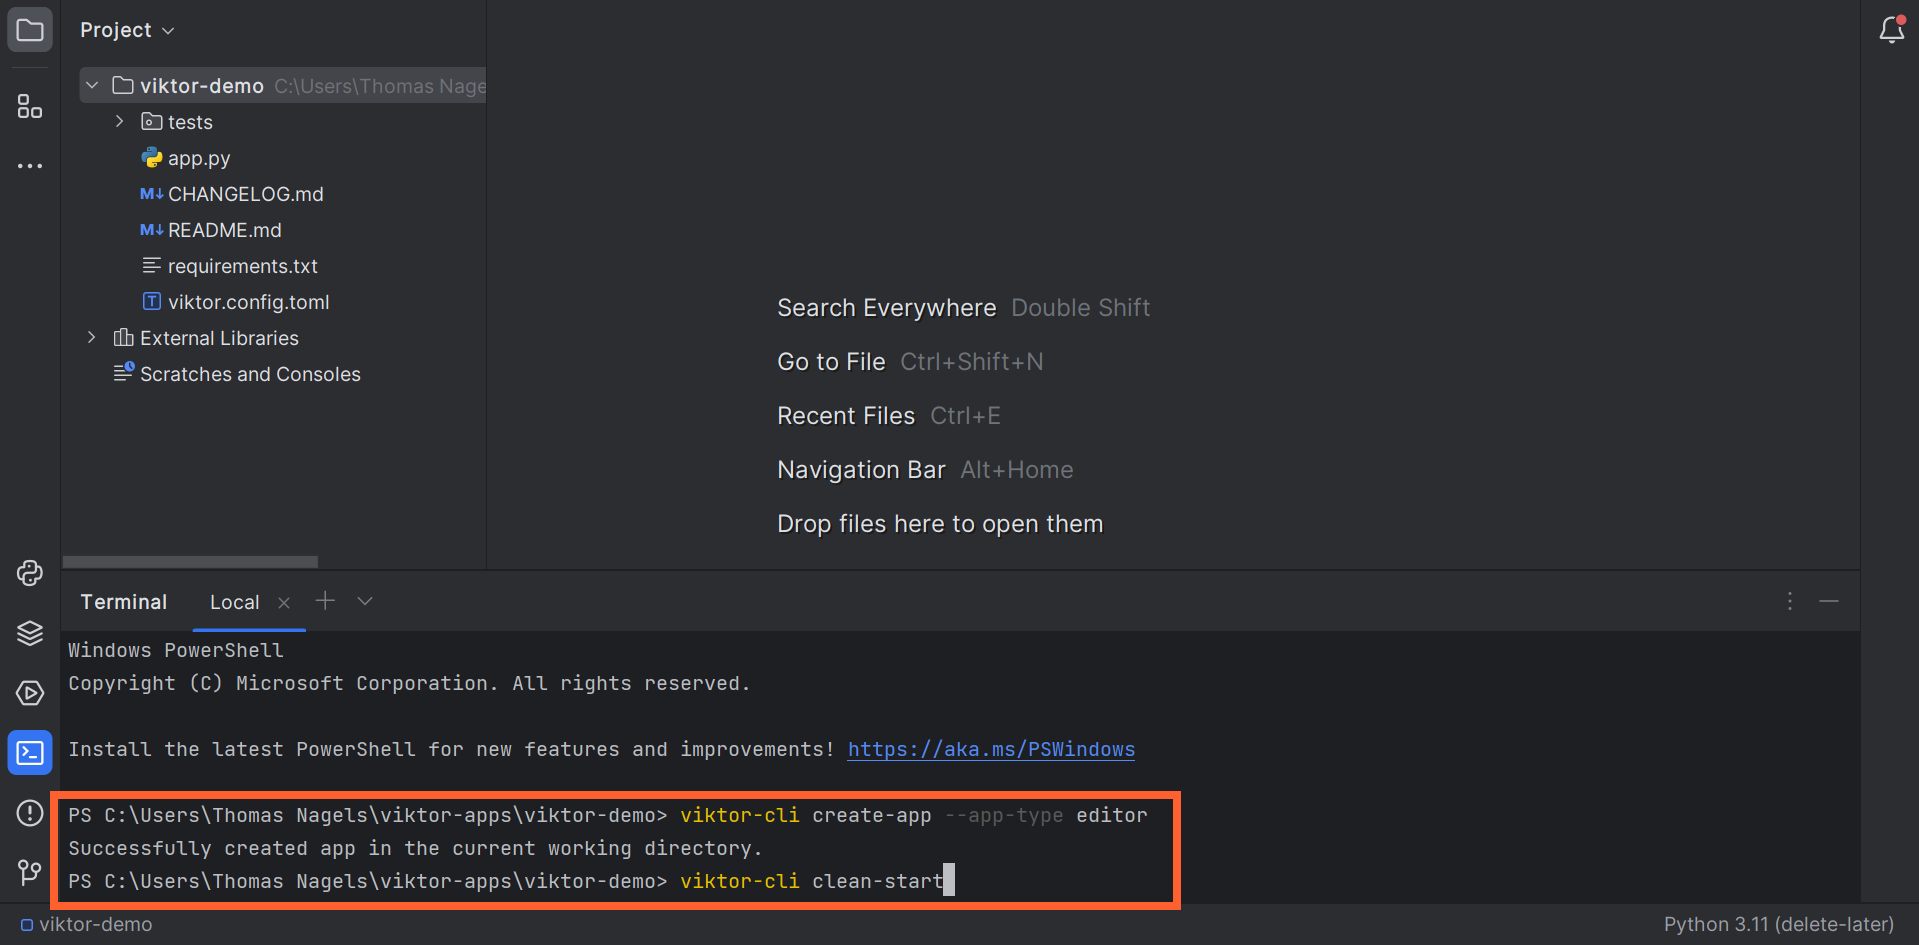
Running this command can take a few minutes. When the installation is complete you will see the following lines printed in the terminal. This means that the app is connected to the VIKTOR platform.
INFO    :  __      __ __  __  __
INFO    :  \ \    / / | | | |/ /
INFO    :   \ \  / /  | | | ' /
INFO    :    \ \/ /   | | |  <
INFO    :     \  /    | | | . \
INFO    :      \/     |_| |_|\_\
INFO    :   _______   ____    _____
INFO    :  |__   __| / __ \  |  __ \
INFO    :     | |   | |  | | | |__) |
INFO    :     | |   | |  | | |  _  /
INFO    :     | |   | |__| | | | \ \
INFO    :     |_|    \____/  |_|  \_\
INFO    : VIKTOR connector vX.Y.Z
INFO    : VIKTOR SDK vX.Y.Z
INFO    : Connecting to platform...
INFO    : Connection is established: <URL>  <---- here you can see your app
INFO    : The connection can be closed using Ctrl+C
INFO    : App is ready
Do not close the terminal as this will break the connection with your app.
App.py structure explained
- The app will update automatically after adding your code and saving the
app.pyfile, as long as you don't close the terminal. - Did you close your code editor or the terminal inside your editor? Use
viktor-cli startto start the app again. No need to run the install and clear commands. - Once your app is started you will be able to interact with it in your Development workspace
Open the app.py file in your code editor. This is where you will write the code of your app.
The content should look like this:
from viktor import ViktorController
from viktor.parametrization import ViktorParametrization


class Parametrization(ViktorParametrization):
    pass


class Controller(ViktorController):
    label = 'My Entity Type'
    parametrization = Parametrization
The app.py file consists of 3 parts:
- Imports: this is where you import Python modules you use in your app.
- Parametrization: this is where you define the inputs of your app.
- Controller: this is where you define the outputs (such as visualizations) and logic of your app.
Add additional imports
To complete this task you will need some additional imports. Copy and paste the imports
at the top of your app.py file. As you can see we will use Matplotlib,
a well-known Python visualization library, to generate the graph.
import numpy as np
import matplotlib.pyplot as plt
from io import StringIO

from viktor.views import ImageResult, ImageView
from viktor.parametrization import NumberField, Text
The resulting app.py will look like this. You can use the snippet below to check your code.
import numpy as np
import matplotlib.pyplot as plt
from io import StringIO

from viktor.views import ImageResult, ImageView
from viktor.parametrization import NumberField, Text
from viktor import ViktorController
from viktor.parametrization import ViktorParametrization


class Parametrization(ViktorParametrization):
    pass


class Controller(ViktorController):
    label = 'My Entity Type'
    parametrization = Parametrization
Define the input fields
As we already determined that the materials and the ratio of offices to residential spaces will be
our parameters of choice, let's add them to the Parametrization class.
You only need to replace the pass statement with the highlighted lines of code.
class Parametrization(ViktorParametrization):
    text_graph = Text('## Graph inputs')
    percentage_green_energy = NumberField('Percentage green energy', variant='slider', min=0, max=100, default=50)
    weight_sustainable_materials = NumberField('Weight of sustainable materials', variant='slider', min=0, max=100, default=70)
As you can see the Text block becomes a nice title for our parameters and the two NumberFields are
modified to be sliders and take a value between 0 and 100.
The resulting app.py will look like this. You can use the snippet below to check your code.
import numpy as np
import matplotlib.pyplot as plt
from io import StringIO

from viktor.views import ImageResult, ImageView
from viktor.parametrization import NumberField, Text
from viktor import ViktorController
from viktor.parametrization import ViktorParametrization


class Parametrization(ViktorParametrization):
    text_graph = Text('## Graph inputs')
    percentage_green_energy = NumberField('Percentage green energy', variant='slider', min=0, max=100, default=50)
    weight_sustainable_materials = NumberField('Weight of sustainable materials', variant='slider', min=0, max=100, default=70)


class Controller(ViktorController):
    label = 'My Entity Type'
    parametrization = Parametrization
Save the app.py file. This action triggers a reload of your app. This reload is shown in the terminal.
If you made a mistake any errors will also be printed in the terminal.
INFO    : Reloading app...
INFO    : App is ready
At this point you must be wondering what the app looks like. The Development workspace is where you can see and use the resulting app. Switch to VIKTOR in your browser. If you continued with this starter guide immediately after activating your account you have been automatically redirected into your Development workspace. In that case simply refresh the browser to see your app. If this is not the case you can open the Development workspace by clicking the open button as you can see in the image below:
After you have entered the development workspace and refresh the page you should see the input fields appear:

Let's add the graph
In this section we will extend your app by adding a graph. In our Controller class, add the highlighted lines of code:
class Controller(ViktorController):
    label = 'My Entity Type'
    parametrization = Parametrization

    @ImageView("Graph", duration_guess=1)
    def starter_guide_graph(self, params, **kwargs):
        fig = plt.figure()
        svg_data = StringIO()
        fig.savefig(svg_data, format='svg')
        return ImageResult(svg_data)
The resulting app.py will look like this. You can use the snippet below to check your code.
import numpy as np
import matplotlib.pyplot as plt
from io import StringIO

from viktor.views import ImageResult, ImageView
from viktor.parametrization import NumberField, Text
from viktor import ViktorController
from viktor.parametrization import ViktorParametrization


class Parametrization(ViktorParametrization):
    text_graph = Text('## Graph inputs')
    percentage_green_energy = NumberField('Percentage green energy', variant='slider', min=0, max=100, default=50)
    weight_sustainable_materials = NumberField('Weight of sustainable materials', variant='slider', min=0, max=100, default=70)


class Controller(ViktorController):
    label = 'My Entity Type'
    parametrization = Parametrization

    @ImageView("Graph", duration_guess=1)
    def starter_guide_graph(self, params, **kwargs):
        fig = plt.figure()
        svg_data = StringIO()
        fig.savefig(svg_data, format='svg')
        return ImageResult(svg_data)
Save app.py and refresh your Development workspace in the browser. The ImageView now shows up as a blank canvas.
To create the graph we will first use numpy (another well-known Python library for scientific computing) to define a range of values
and then use an equation to calculate the potential revenue. You only need to add the highlighted lines of code.
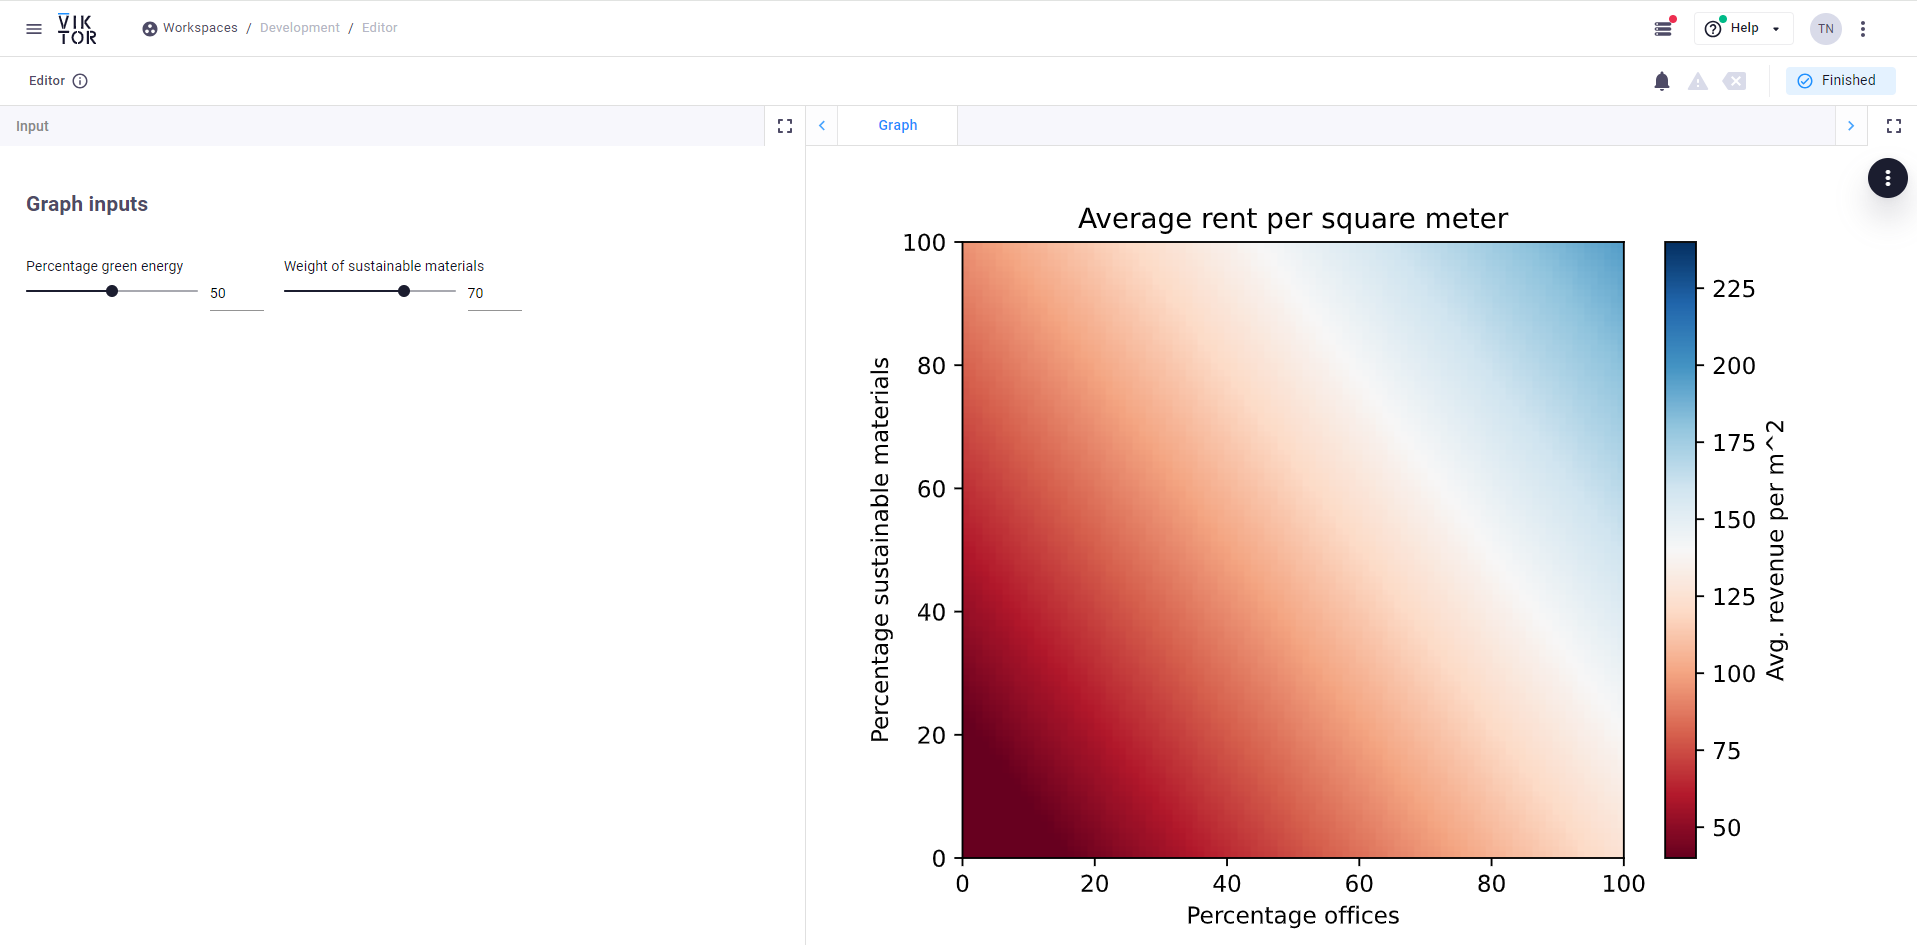
    @ImageView("Graph", duration_guess=1)
    def starter_guide_graph(self, params, **kwargs):
        fig = plt.figure()

        # Define the ranges for office and sustainability
        office = np.linspace(0, 100, 101)
        sustainability = np.linspace(0, 100, 101)
        x, y = np.meshgrid(office, sustainability)

        # Calculate revenue per square meter
        rev_per_sqm =  x + params.weight_sustainable_materials / 100 * y + 0.5 * params.percentage_green_energy

        # Plot the surface
        plt.imshow(rev_per_sqm, extent=(0, 100, 0, 100), origin='lower', cmap='RdBu', aspect='auto', vmin=40 ,vmax=240)
        plt.colorbar(label='Avg. revenue per m²')

        # Set title and axis labels
        plt.title('Average rent per square meter')
        plt.xlabel('Percentage offices')
        plt.ylabel('Percentage sustainable materials')

        svg_data = StringIO()
        fig.savefig(svg_data, format='svg')
        return ImageResult(svg_data)
The resulting app.py will look like this. You can use the snippet below to check your code.
import numpy as np
import matplotlib.pyplot as plt
from io import StringIO

from viktor.views import ImageResult, ImageView
from viktor.parametrization import NumberField, Text
from viktor import ViktorController
from viktor.parametrization import ViktorParametrization


class Parametrization(ViktorParametrization):
    text_graph = Text('## Graph inputs')
    percentage_green_energy = NumberField('Percentage green energy', variant='slider', min=0, max=100, default=50)
    weight_sustainable_materials = NumberField('Weight of sustainable materials', variant='slider', min=0, max=100, default=70)


class Controller(ViktorController):
    label = 'My Entity Type'
    parametrization = Parametrization

    @ImageView("Graph", duration_guess=1)
    def starter_guide_graph(self, params, **kwargs):
        fig = plt.figure()

        # Define the ranges for office and sustainability
        office = np.linspace(0, 100, 101)
        sustainability = np.linspace(0, 100, 101)
        x, y = np.meshgrid(office, sustainability)

        # Calculate revenue per square meter
        rev_per_sqm =  x + params.weight_sustainable_materials / 100 * y + 0.5 * params.percentage_green_energy

        # Plot the surface
        plt.imshow(rev_per_sqm, extent=(0, 100, 0, 100), origin='lower', cmap='RdBu', aspect='auto', vmin=40 ,vmax=240)
        plt.colorbar(label='Avg. revenue per m²')

        # Set title and axis labels
        plt.title('Average rent per square meter')
        plt.xlabel('Percentage offices')
        plt.ylabel('Percentage sustainable materials')

        svg_data = StringIO()
        fig.savefig(svg_data, format='svg')
        return ImageResult(svg_data)
Save app.py and switch to your Development workspace in the browser. You might need to refresh the page for the changes to appear.
As you may have noticed, we have added a title, axis labels, and a legend to the graph to inform the user.
Change some of the input values to see the effect on the resulting visualization! How does this work?
The inputs you defined on the Parametrization are passed to the ImageView method with the params argument.
For example, to use the percentage of green energy in the revenue calculation you reference it by its variable name
params.percentage_green_energy.
Nice! You now know the basics of adding matplotlib graphs to your apps. Do you want to learn how to add an interactive graph? Check out this tutorial.
Continue the next section or come back tomorrow to spread the workload!