Tutorial - Spreadsheet Calculator
Level: Beginners
Time: 20 min
Prerequisites:
- You have an account and completed the installation process. No account? Get one here
- You have some experience with reading Python code

Introduction
Welcome to the spreadsheet calculations tutorial! In most branches of engineering, spreadsheets are the golden standard for sharing results and knowledge in a clear, well organised way. In this tutorial you will learn how to implement an existing calculation from an excel sheet into a VIKTOR web application.
For this, the example we will use is a simply supported beam under load and all the calculations will be performed in the spreadsheet. In this tutorial we will cover:
- Basic setup
- Create, install and start an empty app
- The Excel spreadsheet
- Adding inputs and views
- Downloading the spreadsheet
By the end of this tutorial, you will have created a VIKTOR application that generates calculations from a spreadsheet and that will allow the user to download the results to share with colleagues. You can test the final result below:
1. Create app folder
Is your app code giving you an error? Take a look at the complete app code.
Also know that you can always ask help at our Community Forum, where our developer are ready to help with any question related to the installation, coding and more.
When developing app, you store the code on your hard drive. So let's create some folders to store the code.
-
If you haven't yet, create a folder called
viktor-appsto store all your apps. Let's do this inside your user folder, like shown here:C:\Users\<username>\viktor-appsLINUX
Are you a Linux user? Then make sure the CLI has full rights in the apps directory, by changing its permissions with:
sudo chmod -R 777 ~/viktor-apps -
Inside
viktor-apps, make another folder calledspreadsheet-tutorialfor this project:C:\Users\<username>\viktor-apps\spreadsheet-tutorial
2. Create, install and start an empty app
Let's now create, install and start a blank app template. We will use the blank template to create our spreadsheet calculation app.
But before we start, make sure to shut down any app that is running (like the demo app) by closing the command-line shell
(for example Powershell) or cancel the process using Ctrl + C.
Follow these steps to create, install and start a blank app template:
-
Open your preferred Integrated Development Environment (IDE), like PyCharm or VS Code.
-
Click File -> Open, and open the folder
spreadsheet-tutorialwe created before as a new project. -
Inside your IDE, open the terminal. The keyboard shortcut to open a terminal in PyCharm is
Alt + F12and in VS CodeCtrl+Shift+` -
In the terminal, use the command shown below to create empty app template files inside the folder
spreadsheet-tutorialviktor-cli create-app --app-type editor -
Now we'll install your app and all its dependencies, make sure not to forget to add
plotlyandopenpyxlto therequirements.txtfile! By running the command below, the app will start to install. Just be patient, this could take up to 5 minutes... Maybe it's time for a ☕?viktor-cli clean-startIf all went well, your empty app is installed and running one your development workspace. Do not close the terminal as this will break the connection with your app.
You can see your app which you can see by visiting the URL shown in the terminal (for example https://cloud.viktor.ai)
Your terminal should show something like this:
 INFO     : Connecting to platform...
 INFO     : Connection is established: https://cloud.viktor.ai  <---- here you can see your app
 INFO     : The connection can be closed using Ctrl+C
 INFO     : App is ready
- You only need create an app template and install it once for each new app you want to make.
- The app will update automatically once you start adding code in
app.py, as long as you don't close the terminal or your IDE. - Did you close your IDE? Use
viktor-cli startto start the app again. No need to install, clear, etc.
Did it not work because you got an error messages?
Some troubleshooting
-
Always make sure to check the spelling of everything you placed in the command-line, a small mistake and the command you are trying to run may not be recognised!
-
If you are encountering:
ERROR:
  Exiting because of an error: no requirements.txt file
PS C:\Users\<username>\viktor-apps>
Then you are not in the correct folder! check the command-line and navigate to the spreadsheet-tutorial folder.
-
If you are encountering:
Error: App definition is not compatible with the data currently stored in the database. Use the command 'viktor-cli clear' to clear the database.
PS C:\Users\<username>\viktor-apps\spreadsheet-tutorial>
That means you have not cleared the database yet! Use the
viktor-cli clearto clear and then you can useviktor-cli startto start the app. No need to install it again!
Not seeing any of these errors? Head over to our community! There is a good chance another developer encountered it and solved it too!
Excellent! We can now start by getting our spreadsheet ready and building our app!
3. The Excel spreadsheet
As mentioned previously, this example will be of a simply supported beam under load. If you would like to use or modify the example spreadsheet used for this tutorial, you can download it here [1]. You will need to add your spreadsheet to the root directory/folder, in this case the one we made when we made the empty app named 'spreadsheet-calculator'.
[1] source: https://stuff.mit.edu (04-05-2020)
The app should now have the following folder structure:
spreadsheet-tutorial
├── tests
├── app.py
├── beam_calculation.xls
├── CHANGELOG.md
├── README.md
├── requirements.txt
└── viktor.config.toml
To be able to use a spreadsheet as a calculation tool within a VIKTOR app, a few modifications must be performed to the
spreadsheet file (more elaboration on this can be found here).
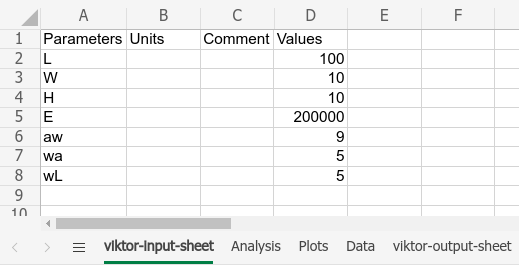
Open beam_calculation.xls and add two sheets: viktor-input-sheet and viktor-output-sheet. These
sheets contain the input and output values respectively. In the viktor-input-sheet, add the following data:
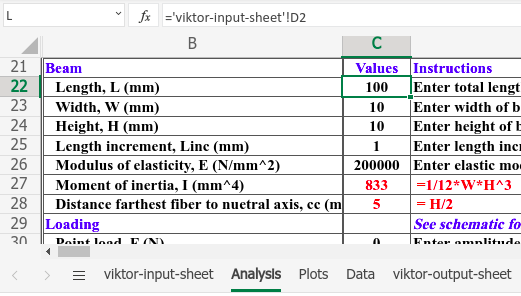
The values from viktor-input-sheet should now be used in the Analysis sheet. For example, cell C22 below refers to
the "L" parameter defined in the viktor-input-sheet sheet:
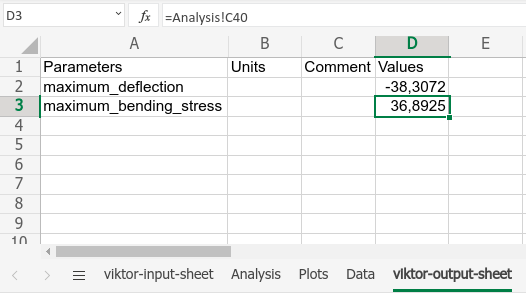
In the viktor-output-sheet the desired output parameters are defined, with their values taken from the Analysis
sheet:
You should now be able to change the values on the viktor-input-sheet, resulting in changed values in the
viktor-output-sheet. If you got lost along the way, or want to take the easy route, download the fully adjusted spreadsheet
here.
Coupling the spreadsheet
The spreadsheet is now ready for use within the app. VIKTOR provides a helper class specifically for this task:
SpreadsheetCalculation. The first thing that needs to be done
is to make sure that we can get to the spreadsheet. For this you may add the function get_evaluated_spreadsheet as described
below, to your Controller class. The app.py file should now look like this:
from pathlib import Path

from viktor import ViktorController
from viktor.parametrization import ViktorParametrization
from viktor.external.spreadsheet import SpreadsheetCalculation, SpreadsheetCalculationInput


class Parametrization(ViktorParametrization):
    pass


class Controller(ViktorController):
    label = 'My Entity Type'
    parametrization = Parametrization

    def get_evaluated_spreadsheet(self, params):
        inputs = [
            SpreadsheetCalculationInput('L', params.beam.length),
            SpreadsheetCalculationInput('W', params.beam.width),
            SpreadsheetCalculationInput('H', params.beam.height),
            SpreadsheetCalculationInput('E', params.beam.E),
            SpreadsheetCalculationInput('aw', params.loads.aw),
            SpreadsheetCalculationInput('wa', params.loads.wa),
            SpreadsheetCalculationInput('wL', params.loads.wL)
        ]
        sheet_path = Path(__file__).parent / 'beam_calculation.xls'
        sheet = SpreadsheetCalculation.from_path(sheet_path, inputs=inputs)
        result = sheet.evaluate(include_filled_file=True)
        return result
Great! Now that we are ready to process the excel sheet, let's start with providing the user with the possibility to enter inputs for that sheet.
4. Adding inputs and views
Our workspace is still a bit empty, lets change that! First, lets add some inputs to our parametrization so that our user
can make changes to the calculations. To reduce the clutter in our app, lets make a Section
for this and fill it with the parameters of the beam.
For the users we will also add an Image to our parametrization that will allow the user
to check the locations and orientations of the parameters. For this we need to make two more modifications to our app:
-
add a new folder called 'assets' to our 'sample-spreadsheets' app folder. You need to add the beam schematic from the top of the Analysis sheet to this folder. The resulting folder structure would look like this:
spreadsheet-tutorial
├── tests
├── assets
    └── beam_schematic.png
├── app.py
├── beam_calculation.xls
├── CHANGELOG.md
├── README.md
├── requirements.txt
└── viktor.config.toml -
in the viktor.config.toml remove the hashtag that in order to add:
assets_path = "assets"to the config. The full config file should now look like this:# For all available configuration settings, please go to:
# https://docs.viktor.ai/docs/create-apps/references/viktor-config-toml
app_type = 'editor'
assets_path = 'assets'
python_version = '3.12' # '3.9' | '3.10' | '3.11' | '3.12'
# welcome_text = 'welcome.md' -
now add the parametrization (as you can see all imports have been included already, those will all be used later on):
from pathlib import Path
import pandas as pd
import plotly.express as px

from viktor import ViktorController
from viktor.external.spreadsheet import SpreadsheetCalculation, SpreadsheetCalculationInput
from viktor.parametrization import ViktorParametrization, DownloadButton, LineBreak, NumberField, Section, Image
from viktor.result import DownloadResult
from viktor.views import DataGroup, DataItem, DataResult, DataView, PlotlyResult, PlotlyView


class Parametrization(ViktorParametrization):
    beam = Section('Beam')
    beam.schematic = Image(path="beam_schematic.png")
    beam.length = NumberField('Length (L)', suffix='mm', default=80, max=100)
    beam.width = NumberField('Width (W)', suffix='mm', default=10)
    beam.height = NumberField('Height (H)', suffix='mm', default=10)
    beam.E = NumberField('Modulus of Elasticity (E)', default=200000, suffix='N/mm2')
This will allow you to change the parameters of the beam which are used in our spreadsheet calculations.
But you may also want to change the way we load the beam. Lets also add some input fields for that in a new Section.
...

class Parametrization(ViktorParametrization):
    beam = Section('Beam')
    beam.schematic = Image(path="beam_schematic.png")
    beam.length = NumberField('Length (L)', suffix='mm', default=80, max=100)
    beam.width = NumberField('Width (W)', suffix='mm', default=10)
    beam.height = NumberField('Height (H)', suffix='mm', default=10)
    beam.E = NumberField('Modulus of Elasticity (E)', default=200000, suffix='N/mm2')

    loads = Section('Loads')
    loads.aw = NumberField('Starting point of load (aw)', suffix='mm', default=9)
    loads.lb = LineBreak()
    loads.wa = NumberField('Distributed load amplitude (wa)', suffix='N/mm', flex=40, default=5)
    loads.wL = NumberField('Distributed load amplitude (wL)', suffix='N/mm', flex=40, default=5)
Showing results and a schematic
If all went well, you should now be able to see all the inputs for the beam and loads in your workspace. Now let's display
some results and a handy schematic so that the user knows what all the inputs mean and which way we have defined as positive
and negative (coordinate system). For the results, lets add a DataView to our controller.
You will need to use the method we made earlier to grab the results from the spreadsheet.
...

class Controller(ViktorController):
    ...

    @DataView('Results', duration_guess=1)
    def get_data_view(self, params, **kwargs):
        result = self.get_evaluated_spreadsheet(params)
        max_deflection = result.values['maximum_deflection']
        max_bending_stress = result.values['maximum_bending_stress']
        data = DataGroup(
            maximum_deflection = DataItem('Maximum Deflection', max_deflection, suffix='microns', number_of_decimals=2),
            maximum_bending_stress = DataItem('Maximum bending stress', max_bending_stress, suffix='N/mm2', number_of_decimals=2)
        )
        return DataResult(data)
After reloading the app, you should now be able to see the maximum deflection and maximum bending stress in the workspace.
If you get stuck, you can always try to have a quick peek at the complete code at the end of this tutorial
Beautiful! If all went well you should now be able to use the schematic as a reference to define your loads and dimensions
of the beam and see the maximum stress and deflection in the DataView.
Adding plots for analysis
To perform some anaysis, lets add a plot to show the curvature along the beam. All the data points for this are already in the excel file so you will only need to extract and plot this data. There is no need to add any parameters so let's add the PlotlyView right away. The data we are using for this example is the deflection data but you can use any other data that the sheet provides as the pandas dataframe will have all the data. We can then make a figure using the plotly.express package and display this figure in our application.
...

class Controller(ViktorController):
    ...

    @PlotlyView('Beam Curvature', duration_guess=1)
    def beam_curvature(self, params, **kwargs):
        result = self.get_evaluated_spreadsheet(params)
        evaluated_file = File.from_data(result.file_content)
        with evaluated_file.open_binary() as fp:
            data_df = pd.read_excel(fp, sheet_name='Data')
        deflection_data = data_df['Deflection (microns)'].head(params.beam.length+1)
        fig = px.line(deflection_data, title='Beam deflection', labels={'value': 'Deflection (microns)', 'index':'Length (mm)'})
        return PlotlyResult(fig.to_json())
5. Download the spreadsheet
Now that we have all the functionality for our spreadsheet calculations, we can download the result as a spreadsheet to share with our colleagues in our next meeting.
...

class Parametrization(ViktorParametrization):
    ...

    calculation_sheet = Section('Download')
    calculation_sheet.button = DownloadButton('Download', 'download_spreadsheet')
Then, to our controller class we need to add the method download_spreadsheet to download the spreadsheet.
...

class Controller(ViktorController):
    ...

    def download_spreadsheet(self, params, **kwargs):
            result = self.get_evaluated_spreadsheet(params)
            return DownloadResult(result.file_content, 'evaluated_beam.xlsx')
Give it a quick test to make sure you made no mistakes and everything works. Now admire the beautiful app you have made!
6. All code together
This is concludes the tutorial, you have now built a fully functional app to perform spreadsheet calculations. Enjoy!!!
Complete code
from pathlib import Path
import pandas as pd
import plotly.express as px

from viktor import ViktorController, File
from viktor.parametrization import ViktorParametrization, NumberField, Section, LineBreak, Image, DownloadButton
from viktor.external.spreadsheet import SpreadsheetCalculation, SpreadsheetCalculationInput
from viktor.views import DataGroup, DataItem, DataResult, DataView, PlotlyView, PlotlyResult
from viktor.result import DownloadResult

class Parametrization(ViktorParametrization):
    beam = Section('Beam')
    beam.schematic = Image(path="beam_schematic.png")
    beam.length = NumberField('Length (L)', suffix='mm', default=80, max=100)
    beam.width = NumberField('Width (W)', suffix='mm', default=10)
    beam.height = NumberField('Height (H)', suffix='mm', default=10)
    beam.E = NumberField('Modulus of Elasticity (E)', default=200000, suffix='N/mm2')

    loads = Section('Loads')
    loads.aw = NumberField('Starting point of load (aw)', suffix='mm', default=9)
    loads.lb = LineBreak()
    loads.wa = NumberField('Distributed load amplitude (wa)', suffix='N/mm', flex=40, default=5)
    loads.wL = NumberField('Distributed load amplitude (wL)', suffix='N/mm', flex=40, default=5)

    calculation_sheet = Section('Download')
    calculation_sheet.button = DownloadButton('Download', 'download_spreadsheet')


class Controller(ViktorController):
    label = 'My Entity Type'
    parametrization = Parametrization

    def get_evaluated_spreadsheet(self, params):
        inputs = [
            SpreadsheetCalculationInput('L', params.beam.length),
            SpreadsheetCalculationInput('W', params.beam.width),
            SpreadsheetCalculationInput('H', params.beam.height),
            SpreadsheetCalculationInput('E', params.beam.E),
            SpreadsheetCalculationInput('aw', params.loads.aw),
            SpreadsheetCalculationInput('wa', params.loads.wa),
            SpreadsheetCalculationInput('wL', params.loads.wL)
        ]
        sheet_path = Path(__file__).parent / 'beam_calculation.xls'
        sheet = SpreadsheetCalculation.from_path(sheet_path, inputs=inputs)
        result = sheet.evaluate(include_filled_file=True)
        return result

    @DataView('Results', duration_guess=1)
    def get_data_view(self, params, **kwargs):
        result = self.get_evaluated_spreadsheet(params)
        max_deflection = result.values['maximum_deflection']
        max_bending_stress = result.values['maximum_bending_stress']
        data = DataGroup(
            maximum_deflection = DataItem('Maximum Deflection', max_deflection, suffix='microns', number_of_decimals=2),
            maximum_bending_stress = DataItem('Maximum bending stress', max_bending_stress, suffix='N/mm2', number_of_decimals=2)
        )
        return DataResult(data)

    @PlotlyView('Beam Curvature', duration_guess=1)
    def beam_curvature(self, params, **kwargs):
        result = self.get_evaluated_spreadsheet(params)
        evaluated_file = File.from_data(result.file_content)
        with evaluated_file.open_binary() as fp:
            data_df = pd.read_excel(fp, sheet_name='Data')
        deflection_data = data_df['Deflection (microns)'].head(params.beam.length+1)
        fig = px.line(deflection_data, title='Beam deflection', labels={'value': 'Deflection (microns)', 'index':'Length (mm)'})
        return PlotlyResult(fig.to_json())

    def download_spreadsheet(self, params, **kwargs):
        result = self.get_evaluated_spreadsheet(params)
        return DownloadResult(result.file_content, 'evaluated_beam.xlsx')
Want to learn how VIKTOR works?
If you are interested in how VIKTOR works behind the scenes, for example how it processes your input, expand the tabs below!
How does it work?
How does the Parametrization work?
In the Parameterization class you can add input fields that allow the user to provide input to your app, and there are more than 20 different input fields you can use, including numbers, text, colors, images and files.
Inside the Parametrization class, you can also format the layout of your app by adding sections, tabs, steps and pages.
To show your Parametrization in the app, we need to add the line parametrization = Parametrization inside the
Controller class, because it is the controller that determines what is shown and not.
How does the Parametrization get saved?
So you may be wondering, how do you get the information from the parametrization to my controller?
Well, we do this automatically for you. The values of all parameters are stored in a single variable called params
, which is accessible inside the Controller class.
These variables are stored in a Munch; this is similar to a dictionary, but work with point denotation.
Example:
- Let's say we have a variable called
heightas a NumberField in ourParameterization. - To use it in a method in the
Controller, define it as:def my_method(self, params, **kwargs) - You can now make calculations inside that method using our height parameter as
params.height!
How does the Controller work?
The Controller class is the place where you add everything you want to calculate and show.
As explained in this tutorial, we show results in a View and we always add views in our controller.
You can even add several views in a single app by adding them to the controller class... and yes, we have
many Views,for showing graphs, maps, 3D models, reports, images and more.
In the Controller, you also do or call your calculation. Remember that the user input given in the parametrization,
is accessible inside the Controller class in the variable The params.
What's next
Very impressive! You have now learned the basics of working with external files and programs. In this tutorial, we have only scratched the surface of what you can do these integrations. So don’t stop your journey there!
You can now also use the Excel Converter App to instantly generate boilerplate code for your specific excel integrated apps!
If you like an extra challenge, here are some ideas:
- Convert your excel sheet to a pdf and show it in a
PDFView - Try to adjust the geometry to show the deformation of the beam
- Or even try to re-write the logic of your Excel file to a python script to use directly in the app code!
If you enjoyed this spreadsheet tutorial and want to explore some of the possibilities with Excel and VIKTOR, check out some of our other tutorials
You can find more information about how to use excel sheets in the documents and spreadsheets guide. Also check more about documents and spreadsheets in general